| Lesson 12 | Buffer cache hit ratio scope |
| Objective | Compute the buffer cache hit ratio for a specific period of time. |
Buffer cache hit Ratio Scope
The previous lesson on computing the buffer cache hit ratio focused on using
statistics that have accumulated since the database was started. You may occasionally want to compute the buffer cache hit ratio for a specific period of time. You can do that by following the procedure shown in this Slide Show:

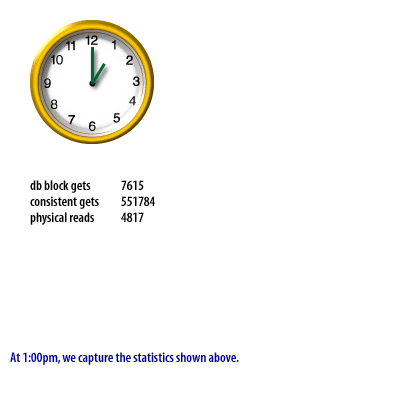
"The first thing that you need to do is decide on the specific time period over which you want to compute the buffer cache hit ratio. Let's use 1:00pm - 2:00pm for this example."
Contextual Analysis:
- Topic: Oracle buffer cache hit ratio — a key performance metric used to determine how effectively Oracle is using memory to avoid disk reads.
- Instruction: The image emphasizes choosing a specific time window (in this case, 1:00 PM to 2:00 PM) as the first step before performing calculations.
- Visual Aid: The analog clock reinforces the time period mentioned in the instructional text.

- Statistics at 1:00 PM:
- db block gets: 7615
- consistent gets: 551784
- physical reads: 4817
- Text Below:
- "At 1:00pm, we capture the statistics shown above."
This data is part of calculating the Oracle buffer cache hit ratio, typically using the formula:

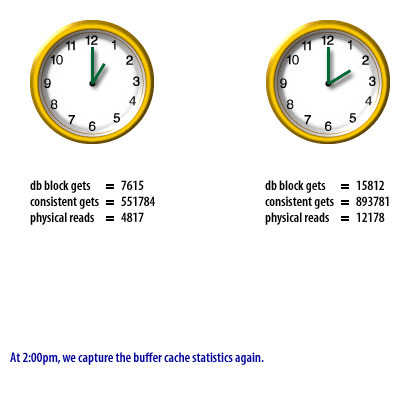
- At 1:00 PM
- db block gets = 7615
- consistent gets = 551784
- physical reads = 4817
- At 2:00 PM
- db block gets = 15812
- consistent gets = 893781
- physical reads = 12178
Caption Text:
*"At 2:00pm, we capture the buffer cache statistics again."*

- At 1:00 PM
- db block gets = 7615
- consistent gets = 551784
- physical reads = 4817
- At 2:00 PM
- db block gets = 15812
- consistent gets = 893781
- physical reads = 12178
- Differences (2:00 PM - 1:00 PM)
- db block gets = 15812 − 7615 = 8197
- consistent gets = 893781 − 551784 = 341997
- physical reads = 12178 − 4817 = 7361
*"The next step is to compute the differences between the beginning and ending values."*

- 🕐 At 1:00 PM
- db block gets = 7615
- consistent gets = 551784
- physical reads = 4817
- 🕑 At 2:00 PM
- db block gets = 15812
- consistent gets = 893781
- physical reads = 12178
📊 Differences (2:00 PM − 1:00 PM)
- db block gets = 8197
- consistent gets = 341997
- physical reads = 7361
12178 − 4817 = 7361
🧮 Buffer Cache Hit Ratio Formula Shown:
$$ 1 - \left( \frac{\text{physical reads}}{\text{consistent gets} + \text{db block gets}} \right) $$
$$ 1 - \left( \frac{7361}{341997 + 8197} \right) = 0.978$$
"The differences represent the buffer cache activity during the period of time being measured, and are used to compute the buffer cache hit ratio during that time."
By computing the buffer cache hit ratio over a short period of time, you may notice variations that aren't apparent when you look at the
cumulative hit ratio since the database was last opened.
🚗 Analogy: DIY Odometer vs. Trip Computer
The tutorial's manual logging of 1) db block gets, 2) consistent gets, and 3) physical reads is like recording your car's odometer at each
fill-up to compute gas mileage. It's excellent for understanding how the calculation works and what each term means.
But in production: Modern cars have a trip computer that computes your mileage more accurately, and automatically.
But in production: Modern cars have a trip computer that computes your mileage more accurately, and automatically.
🔍 Applying that to Oracle
Now that we’ve explored the buffer cache hit ratio and its calculation, let’s consider practical ways to optimize it, such as adjusting buffer pool sizes or leveraging Oracle’s AWR for automated, reliable performance metrics."If you need a more precise excerpt or specific details from the segue, please provide the text directly or clarify further, and I can tailor the response accordingly. Alternatively, I can generate an HTML unordered list for any related elements you’d like to include, consistent with your previous requests.
With Oracle Database 23 AI (or modern versions), a DBA doesn’t manually sample V$SYSSTAT over time. Instead, you rely on:
✅ The AWR (Automatic Workload Repository) report
📌 Specifically, AWR shows:
✅ Conclusion
In the next lesson, you will monitor the efficiency of the shared pool.
With Oracle Database 23 AI (or modern versions), a DBA doesn’t manually sample V$SYSSTAT over time. Instead, you rely on:
✅ The AWR (Automatic Workload Repository) report
- Captures snapshots of V$SYSSTAT at regular intervals
- Automatically calculates the buffer cache hit ratio, along with other efficiency metrics
- Provides accurate, interval-based reporting that is far simpler and more reliable
📌 Specifically, AWR shows:
- consistent gets
- db block gets
- physical reads
- And computes the buffer cache hit ratio using the formula
✅ Conclusion
- The tutorial is great for teaching the principle of how buffer cache efficiency works and how the ratio is derived.
- But a professional managing Oracle 23 AI would rely on AWR to yield the same metrics automatically and reliably in real time.
In the next lesson, you will monitor the efficiency of the shared pool.