| Lesson 15 | Monitoring I/O |
| Objective | Monitor the I/O load across drives. |
Monitoring I/O
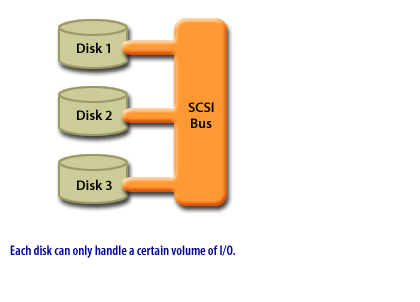
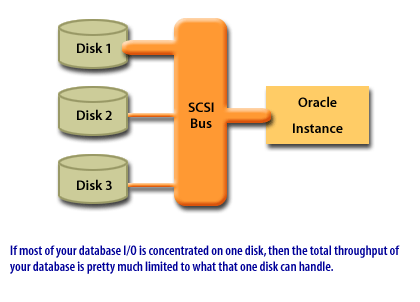
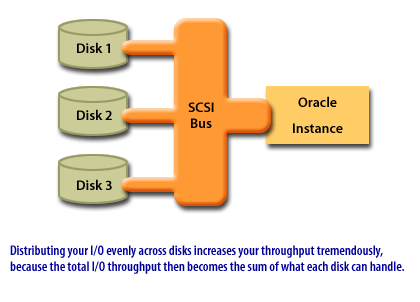
Avoiding disk I/O bottlenecks is key to achieving good performance from a database. One of your goals as a DBA should be to spread I/O evenly across your disks to maximize throughput. This Slide Show explains why:

1) Distribute IO 1

2) Distribute IO 2

3) Distribute IO 3
utlbstat | utlestat
The statistics generated by
utlbstat/utlestat can help you track how well you've distributed the I/O load for a database. Following is an excerpt from a database statistics report. Several columns of output have been removed to make this fit, but the read and write counts remain. The READS column shows the number of reads from each file. The WRITES column shows the number of writes to each file.
TABLE_SPACE FILE_NAME        READS          WRITES

----------- -------------    ----------     ----------

INDX        E:\ORACLE\ORA...          3 ...          3

RBS         E:\ORACLE\ORA...         10 ...        673

SYSTEM      E:\ORACLE\ORA...       1637 ...        584

TEMP        E:\ORACLE\ORA...        292 ...        704

USERS       E:\ORACLE\ORA...         28 ...          3

USERS       E:\ORACLE\ORA...         61 ...         21
The numbers are lower than what you would see in a production database, but serve to illustrate a point: It's obvious that the files for the
File I/O statistics come from a performance view named v$filestat. The
RBS, SYSTEM, and TEMP tablespaces carry a much heavier I/O load than the other files, yet they all share the same disk. In a production setting, you would be wise to place these heavily used files on separate disks to distribute the I/O better. The truth is, I/O patterns can change over time, so you have to check them periodically and revisit file placement if necessary.
File I/O statistics come from a performance view named v$filestat. The
utlbstat and utlestat scripts query that view, and the resulting report shows the differences between the starting and ending values.
In the next lesson, you will detect and resolve contention for the redo log buffer.