| Lesson 8 | Monitoring replication events with the V$ views |
| Objective | Explain how to monitor replication by querying V$ views. |
Monitoring Replication Events Using V$ Views in Oracle 23c
Oracle 23c continues to support dynamic performance views (`V$` views), which are vital tools for database administrators monitoring internal database operations. These views include diagnostic details for wait events[1], including those associated with 1) replication and 2)Advanced Queuing (AQ), which now forms a key part of Oracle's event-driven architecture.
Oracle has enhanced the replication infrastructure significantly since Oracle 8i, but it still retains backward-compatible V$ views like `V$EVENT_NAME`. These views track session-level wait events, including those related to queue-based message handling and replication mechanisms.
Caution on V$ Views: It is important to note that the `V$EVENT_NAME` and other dynamic performance views are "not guaranteed to be stable across patch levels or major versions". Oracle may introduce, deprecate, or rename wait events in response to changes in the internal kernel behavior. Therefore, application developers and DBAs should avoid hard dependencies on specific wait event names for long-term monitoring scripts.
Structure of `V$EVENT_NAME` in Oracle 23c:
Returns:
Oracle 23c includes several hundred wait events, but two remain especially relevant for replication and queuing:
Oracle has enhanced the replication infrastructure significantly since Oracle 8i, but it still retains backward-compatible V$ views like `V$EVENT_NAME`. These views track session-level wait events, including those related to queue-based message handling and replication mechanisms.
Caution on V$ Views: It is important to note that the `V$EVENT_NAME` and other dynamic performance views are "not guaranteed to be stable across patch levels or major versions". Oracle may introduce, deprecate, or rename wait events in response to changes in the internal kernel behavior. Therefore, application developers and DBAs should avoid hard dependencies on specific wait event names for long-term monitoring scripts.
Structure of `V$EVENT_NAME` in Oracle 23c:
DESC V$EVENT_NAME;
Returns:
EVENT#: Unique identifier for the wait event.NAME: Descriptive name of the event.PARAMETER1: First parameter (e.g., Queue ID).PARAMETER2: Second parameter (e.g., Process Number).PARAMETER3: Third parameter (e.g., Wait Time or Additional Context).
Oracle 23c includes several hundred wait events, but two remain especially relevant for replication and queuing:
- queue messages: Indicates a session is waiting for a message to be dequeued from an Advanced Queue (AQ). This is typical in event-driven or messaging-based database applications.
- replication dequeue: Signals that a session is performing a dequeue operation in the context of Oracle GoldenGate-based replication or other internal replication mechanisms.
Sample Query to Monitor Wait Events:
To view active wait events related to queuing and replication, run:
SELECT NAME,
       PARAMETER1 AS queue_id,
       PARAMETER2 AS process_number,
       PARAMETER3 AS wait_time
FROM   V$EVENT_NAME
WHERE  NAME IN ('queue messages', 'replication dequeue');
The `wait_time` (from `PARAMETER3`) indicates the duration the session has waited on the event, which can help identify bottlenecks in message processing or replication lag[2].
Use Case:
Monitoring these wait events is especially useful when diagnosing:
Oracle 23c's continued support for dynamic performance views ensures deep visibility into the internal workings of the database engine, while embracing cloud-optimized, event-driven, and microservice-based deployment architectures.
- Delays in queue message processing in Advanced Queueing or DBMS_STREAMS.
- Latency or stalling in Oracle GoldenGate Replication.
- Situations where snapshot refreshes or queue consumers are not processing data as expected.
Oracle 23c's continued support for dynamic performance views ensures deep visibility into the internal workings of the database engine, while embracing cloud-optimized, event-driven, and microservice-based deployment architectures.
How these "wait events" fit into Oracle replication and queuing workflows in 23c.
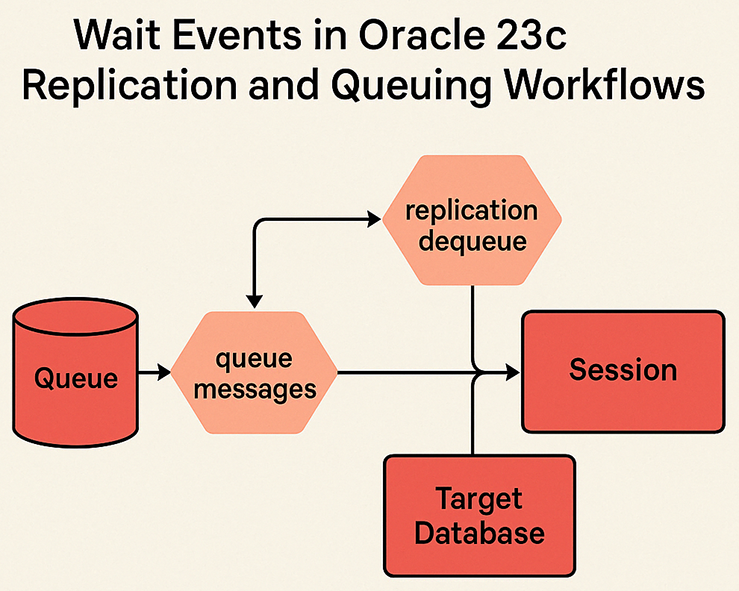
Component Breakdown:
- Queue (Leftmost Block):
- Represents the Advanced Queue (AQ) that holds messages waiting to be processed.
- This is typically part of Oracle Streams, DBMS_AQ, or GoldenGate-based architectures.
-
queue messages (Hexagon):
- A wait event indicating a session is blocked waiting for a message to arrive in the queue.
- Occurs when there are no messages to dequeue, and the consumer session is idle.
-
replication dequeue (Hexagon):
- Another wait event, triggered when replication mechanisms (such as Oracle GoldenGate) are in the process of dequeuing data for replication.
- Tied to internal replication server processes and message consumption.
-
Session (Rectangle):
- Represents an Oracle session that is either enqueueing or dequeueing messages as part of a transaction or replication workflow.
- This session encounters wait states depending on message availability and replication latency.
-
Target Database (Rectangle):
- The replication destination, which receives messages or changes from the source.
- This component processes data after successful dequeue events.
Flow Summary:
- Messages are enqueued into the Queue.
- When a session attempts to dequeue and the queue is empty, it encounters the
queue messageswait event. - If the session is involved in replication, it may also wait on the
replication dequeueevent. - Once a message is available, it is dequeued and applied to the Target Database by the active Session.
This flow reflects how Oracle 23c provides visibility into replication-related delays and bottlenecks via internal wait events, which can be monitored using the `V$EVENT_NAME` dynamic view.
[1]
wait events:Within Oracle GoldenGate Replication, wait events signify the times when a process, such as Extract or Replicat, pauses its operation while waiting for a specific resource or condition to be met. Analyzing these wait events is crucial for identifying performance bottlenecks and understanding the underlying causes of latency in the data replication pipeline.
[2]
Replication lag: Replication lag in Oracle GoldenGate refers to the time delay between a transaction committing on the source database and the corresponding transaction being applied to the target database. This delay can be influenced by network latency, processing capacity of the GoldenGate processes, and the volume of transactional data being replicated.