A Sample Decision Process for Performance Conceptual Modeling
Conceptual modeling is almost deterministic. However, as your performance tuning experience increases, you will appreciate that there are no real rules to follow. A flexible heads-up approach is required to interpret the various statistics and make good decisions.
For a quick and easy approach to performance tuning, use the Automatic Database Diagnostic Monitor (ADDM). ADDM automatically monitors your Oracle system and provides recommendations for solving performance problems should problems occur. For example, suppose a DBA receives a call from a user complaining that the system is slow. The DBA simply examines the latest ADDM report to see which of the recommendations should be implemented to solve the problem. The following steps illustrate how a performance engineer might look for bottlenecks without using automatic diagnostic features. These steps are onlyintended as a guideline for the manual process. With experience, performance engineers add to the steps involved.
This analysis assumes that statistics for both the operating system and the database have been gathered.
- Run Time Acceptable:
- Is the response time/batch run time acceptable for a single user on an empty or lightly loaded machine? If it is not acceptable, then the application is probably not coded or designed optimally, and it will never be acceptable in a multiple user situation when system resources are shared. In this case, get application internal statistics, and get SQL Trace and SQL plan information. Work with developers to investigate problems in data, index, transaction SQL design, and potential deferral of work to batch/background processing.
- Is all the CPU being utilized? If the kernel utilization is over 40%, then investigate the operating system for network transfers, paging, swapping, or process thrashing. Otherwise, move onto CPU utilization in user space. Check to see if there are any non-database jobs consuming CPU on the machine limiting the amount of shared CPU resources, such as backups, file transforms, print queues, and so on. After determining that the database is using most of the CPU, investigate the top SQL by CPU utilization. These statements form the basis of all future analysis. Check the SQL and the transactions submitting the SQL for optimal execution. Oracle provides CPU statistics in V$SQL. If the application is optimal and there are no inefficiencies in the SQL execution, consider rescheduling some work to off-peak hours or using a bigger machine.
- At this point, the system performance is unsatisfactory, yet the CPU resources are not fully utilized. In this case, you have serialization and unscalable behavior within the server. Get the WAIT_EVENTS statistics from the server, and determine the biggest serialization point. If there are no serialization points, then the problem is most likely outside the database, and this should be the focus of investigation. Elimination of WAIT_EVENTS involves modifying application SQL and tuning database parameters. This process is very iterative and requires the ability to drill down on the WAIT_EVENTS systematically to eliminate serialization points.
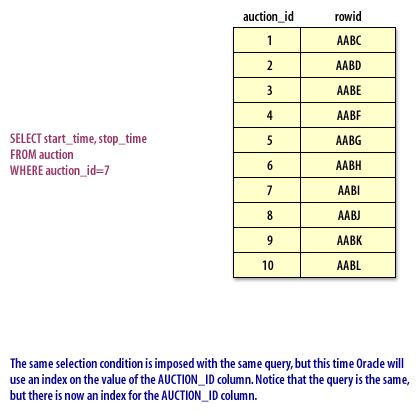
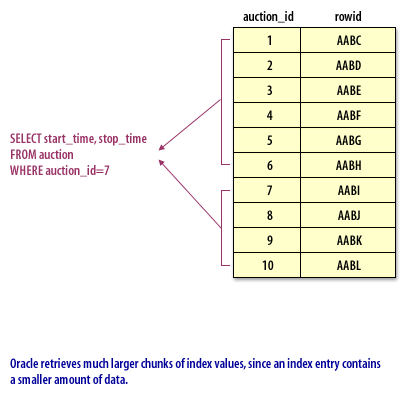
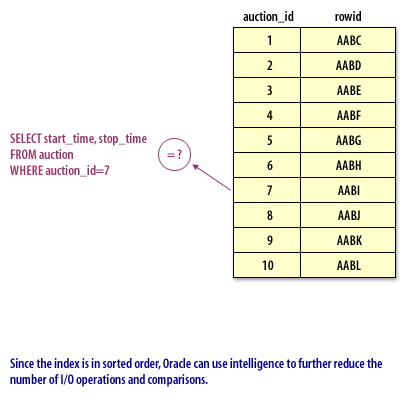
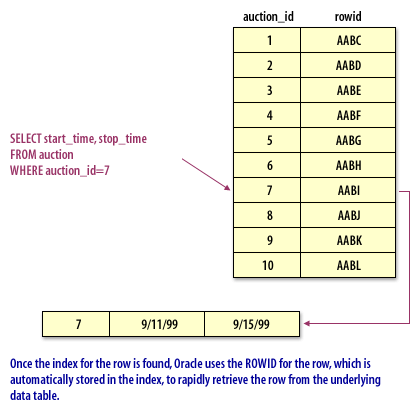
Data Access through an index


SELECT start_time, stop_time
FROM auction
WHERE auction_id=7