| Lesson 4 | Background and user process trace files |
| Objective | Interpret information contained in trace files. |
Background User process
Trace files are generated by the Oracle background processes (i.e. pmon, smon,
dbwr) or by server processes that connect to Oracle. While trace files are primarily used by Oracle technical support, they can also be used by
the DBA to diagnose problems.
Reading trace files
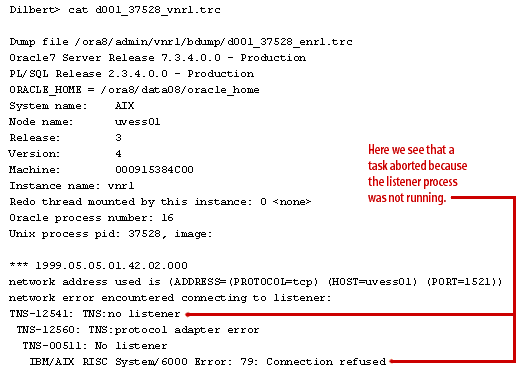
To illustrate, view the code below to examine the trace file.
This information is fairly easy to locate and interpret. However, many trace files contain dumps of memory and other cryptic pieces of information that are not nearly as easy to understand. Also, many trace files are much, much longer and more complex than the one shown above.
Reading trace files with tkprof
Oracle provides a tool for interrogating trace files called tkprof. This tool formats SQL session trace files so that they provide useful information in a readable format. Note that tkprof is only useful for reading trace files that are related to SQL execution.
Using tkprof to format a trace file is very simple. To see all of the features of tkprof, just enter
Using tkprof to format a trace file is very simple. To see all of the features of tkprof, just enter
tkproffrom the UNIX prompt:
dilbert> tkprof
Next, you will invoke tkprof. Do this by entering
tkprof trace_file_name.trc output_file_name
at the UNIX prompt. For example:
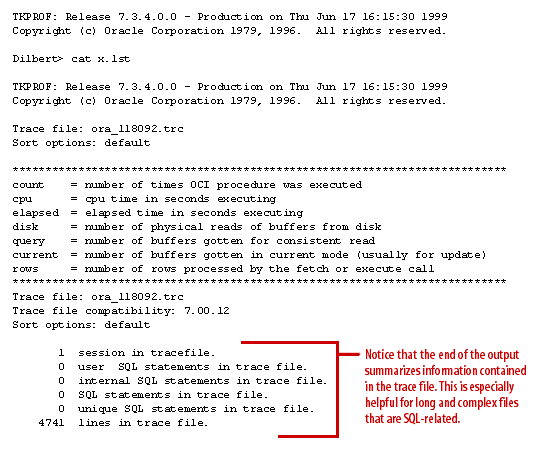
dilbert> tkprof ora_118092.trc x.lst
View the Code below to see what the output will look like.

Now, you will learn how to create trace files for individual sessions.
[1]TKProfTKProf is an Oracle database utility used to format SQL Trace output into human readable format. The TKProf executable is located in the ORACLE HOME/bin directory.