EXPLAIN PLAN  «Prev  Next»

Lesson 9Complex EXPLAIN PLAN outputs
Objective Analyze a complex EXPLAIN PLAN.

Analyze complex EXPLAIN PLAN and Complex EXPLAIN PLAN Outputs

Oracle SQL Analyzer: Unraveling the Mysteries of Complex EXPLAIN PLAN Outputs

When embarking on the intricate journey of understanding and optimizing SQL statements in Oracle, the compass you invariably reach for is the EXPLAIN PLAN tool. The tool provides a visual representation of the access path that the Oracle optimizer chooses to execute a SQL statement. However, when faced with complex outputs, it can seem like trying to read an ancient script. Fear not! Here's a guide to help you deconstruct and analyze the labyrinth of EXPLAIN PLAN outputs.
  1. Setting the Stage: Generating an EXPLAIN PLAN: Before we dissect the output, ensure you've generated the EXPLAIN PLAN correctly.
    EXPLAIN PLAN FOR 
    [your SQL statement here];
    

    Then, to view the generated plan:
    SELECT * 
    FROM TABLE(DBMS_XPLAN.DISPLAY);
    
  2. Interpreting Key Terms: Complex outputs are studded with terms that might initially sound foreign. Here's a primer:
    • Operation: The action taken, e.g., `SELECT STATEMENT`, `TABLE ACCESS`, or `INDEX SCAN`.
    • Options: Additional information about the operation, e.g., `BY INDEX ROWID`, `RANGE SCAN`, etc.
    • Object Name: The database object (table, index, view, etc.) affected by the operation.
    • Cardinality: Estimated number of rows processed.
    • Bytes: The amount of data processed.
    • Cost: The optimizer's estimate of resource consumption for the operation.
  3. Key Insights from Hierarchical Structure: EXPLAIN PLAN outputs are displayed in a hierarchical tree structure:
    • The top-most operation (usually `SELECT STATEMENT`) is the root.
    • Child operations provide details on how each subsequent operation fetches and processes the data.
    Understanding the hierarchical order is crucial as it gives a sense of the sequence and nesting of operations.
  4. Spotting Performance Bottlenecks: Intricate plans often have performance bottlenecks. Look for:
    • Full Table Scans: Usually more expensive than index scans, unless the table is small or the query needs a large data subset.
    • Nested Loops: Can be inefficient for large data sets.
    • High Costs: Operations with particularly high costs relative to others might be bottlenecks.
  5. Using the RIGHT Tools: Oracle offers the SQL Tuning Advisor which can be invoked through Oracle SQL Developer or Oracle Enterprise Manager. This tool provides actionable recommendations to optimize the SQL's performance.
  6. Advanced Plan Analysis with DBMS_XPLAN: DBMS_XPLAN offers more detailed displays like `DISPLAY_CURSOR`, which gives insights about the actual execution of the query, or `DISPLAY_AWR` that retrieves the plan from AWR history.
    SELECT * 
    FROM TABLE(DBMS_XPLAN.DISPLAY_CURSOR(NULL,NULL,'ALLSTATS LAST'));
    
  7. Cross-check with Actual Execution: Always remember that EXPLAIN PLAN shows the optimizer's *estimate*. It's essential to cross-check with actual run-time statistics.
  8. Do not Forget the Basics: Indexing, gathering updated statistics with `DBMS_STATS`, and ensuring the optimizer environment (e.g., initialization parameters) is optimal play pivotal roles in ensuring efficient execution paths.

The Oracle EXPLAIN PLAN is a cartographer’s dream containing a detailed map of the query's journey in the world of Oracle databases. Like any map, its true value is unlocked when the traveler understands its legends, symbols, and intricacies. So, the next time you're confronted with a seemingly convoluted EXPLAIN PLAN output, take a deep breath, consult this guide, and embark on the journey to optimization with confidence. Safe travels in the realm of SQL optimization!
Tools to analyze Complicated Outputs

It is not uncommon for a complex SQL query to have dozens, or even hundreds of entries in the PLAN table. For these complex queries, there are a host of tools that are offered to assist in interpreting the output.
The most popular tools include:
  1. Oracle SQL Analyzer – By Oracle
  2. Q Diagnostic Center – By Savant Software
  3. SQLab – by Quest Software
To see how these tools work, let us examine a common DBA query to select all users that do not have privileges that are granted via a role (e.g., a direct GRANT to a table). Here we see a non-correlated subquery:

SELECT 
   USERNAME 
FROM 
   dba_users
WHERE 
   USERNAME NOT IN
   (SELECT 
      GRANTEE 
    FROM 
      dba_role_privs
    )
;

As illustrated in the in Lesson 7, a common DBA query to select all users that have privileges but not those granted via a role, the main part of the select statement simply selects the username from dba_users. The most informative part, however, is in the WHERE clause. Here we select username where there is not a matching row in the dba_role_privs table.

View the code below to see the complex EXPLAIN PLAN.
OPERATION
----------------------------- -----------------------------------
OPTIONS                       OBJECT_NAME              POSITION
----------------------------- ----------------------- ----------
SELECT STATEMENT
 FILTER
   MERGE JOIN
     SORT JOIN                                              1
       NESTED LOOPS                                         1
         NESTED LOOPS                                       1
           NESTED LOOPS                                     1
             MERGE JOIN                                     1
               SORT JOIN                                    1
                 NESTED LOOPS                               1
                   TABLE ACCESS FULL USER_ASTATUS_MAP       1
                   TABLE ACCESS BY INDEX ROWID PROFILE$     2
            INDEX RANGE SCAN I_PROFILE                      1
             SORT TABLE ACCESS FULL  USER$                  1
             TABLE ACCESS CLUSTER TS$                       2
                INDEX UNIQUE SCAN I_TS#                     1
            TABLE ACCESS CLUSTER TS$                        2
              INDEX UNIQUE SCAN I_TS#                       1
          TABLE ACCESS BY INDEX ROWID PROFILE$              2
            INDEX RANGE SCAN   I_PROFILE                    1
      SORT JOIN                                             2
			TABLE ACCESS FULL PROFNAME$         1
    VIEW                     DBA_ROLE_PRIVS                 2
      SORT GROUP BY                                         1
     NESTED LOOPS                                           1
     NESTED LOOPS OUTER                                     1
            NESTED LOOPS                                    1
              TABLE ACCESS FULL USER$                       1
              TABLE ACCESS BY INDEX ROWID SYSAUTH$          2
                INDEX RANGE SCAN I_SYSAUTH1                 1
            INDEX UNIQUE SCAN I_DEFROLE1                    2
          TABLE ACCESS CLUSTER USER$                        2
            INDEX UNIQUE SCAN I_USER#                       1

34 rows selected.                               

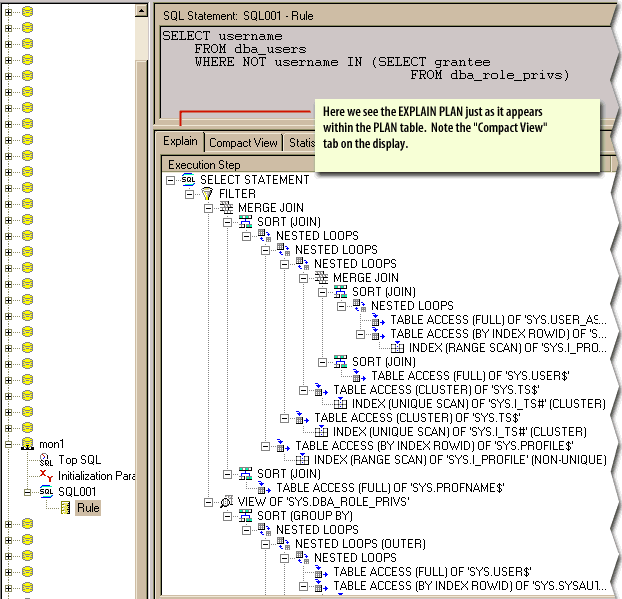
We can simplify this output to make it more understandable by using the Oracle SQL Analyzer tool.
We simply call-up the query and explain it.
Explain Plan 1
SELECT username
 FROM dba_users
 WHERE NOT username IN 
 (SELECT grantee FROM dba_role_privs)

Explain Plan 2
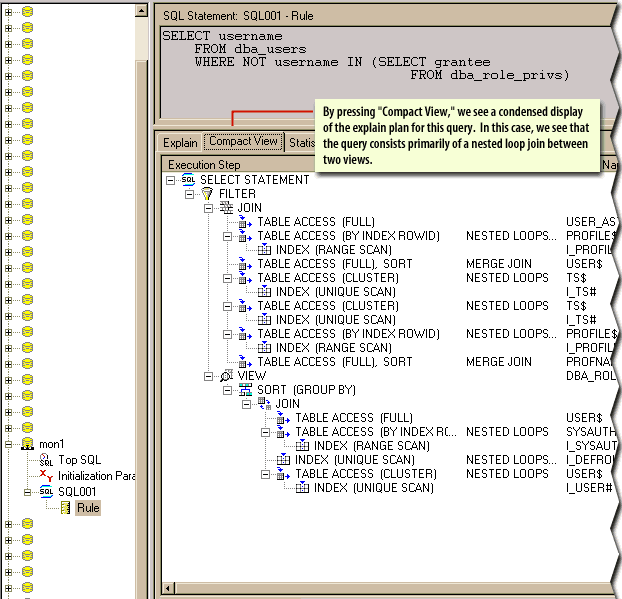
By pressing "Compact View", we see a condensed display of the explain plan for this query. In this case, we see that the query consists primarily of a nested loop join between two views.

The next lesson will conclude this module discussing the explain-plan utility.