| Lesson 4 | Characteristics of a full-table scan |
| Objective | Explain full-table scan and buffer hit ratio. |
Full Table Scan and Buffer Hit Ratio
A full-table scan (FTS) is an access path where Oracle reads table blocks under the
high water mark (HWM) and evaluates predicates while scanning. In an execution plan, this commonly
appears as TABLE ACCESS FULL.
The buffer hit ratio (also called “buffer cache hit ratio”) is a legacy, high-level indicator of how often Oracle satisfies block requests from memory instead of reading blocks from storage. It is easy to compute, but it is frequently misunderstood and is not sufficient—by itself—for modern performance tuning.
How a full-table scan works
In a full-table scan, Oracle reads formatted blocks up to the table’s HWM. Blocks above the HWM were never used and are not read. Many full scans are efficient because Oracle can perform large, sequential I/O operations and avoid random I/O patterns typical of index-driven access.
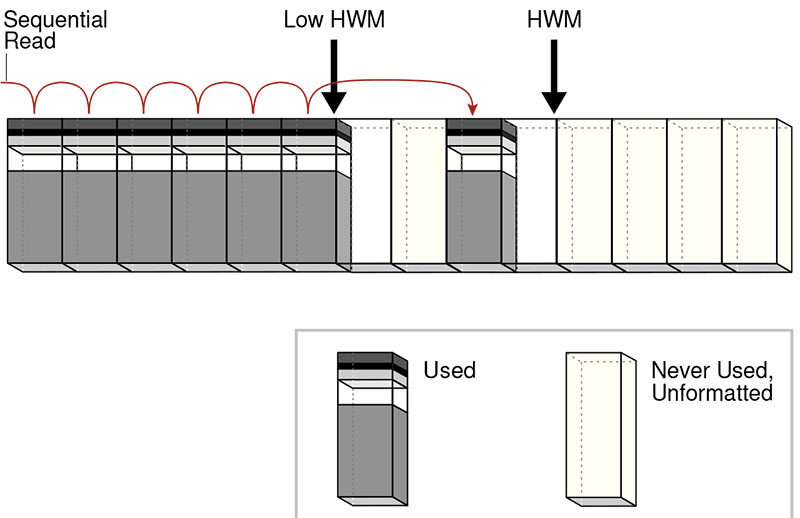
- Sequential read path moves across formatted (used) blocks.
- Low HWM and HWM mark boundaries within the segment.
- Never used / unformatted blocks beyond the HWM are skipped.
Because table blocks are adjacent on disk within extents, Oracle can improve scan throughput using multiblock reads.
Historically this was associated with DB_FILE_MULTIBLOCK_READ_COUNT, but in modern Oracle releases this
behavior is largely auto-managed. Treat this parameter as “leave at default unless Oracle Support instructs otherwise.”
Full-table scans also interact with caching rules. Oracle may:
- read blocks into the buffer cache (buffered reads), or
- use direct path reads for certain scans (bypassing the buffer cache) to avoid displacing hot cached blocks.
Caching blocks during a full-table scan
Appropriate vs. unexpected full-table scans
A full-table scan is not automatically “bad.” It is often the best plan choice when:
- Tables are small (index access overhead can cost more than scanning).
- The query returns a large fraction of rows (index + table lookups become expensive).
- Workloads are scan-oriented (reporting, batch processing, analytics).
A full-table scan is unexpected when the query is selective and an index should allow Oracle to navigate directly to a small set of rows. Common root causes include missing indexes, stale statistics, predicate transformations (functions/implicit conversions), or skewed data.
Oracle 23ai perspective: full scans and buffer hit ratio are not tightly coupled
In modern Oracle (including 23ai), you should not tune full-table scan performance by “chasing” a high buffer hit ratio. Large scans may use buffered reads or direct path reads depending on workload, object size, and execution strategy (for example, parallel query). When direct path reads are used, blocks bypass the buffer cache, which makes the global buffer hit ratio a weak indicator for scan performance.
A more reliable approach is to:
- verify access paths with execution plans (
DBMS_XPLAN), - measure scan-related I/O with wait events and SQL-level statistics, and
- ensure statistics accurately represent the data distribution.
Buffer hit ratio: definition and equation
The buffer hit ratio is commonly described as the percentage of logical reads that do not require a physical read from storage.
Buffer hit ratio approximates the ratio of logical reads satisfied from memory to total logical reads.
Equation for buffer hit ratio
Hit Ratio = (Logical Reads - Physical Reads) / Logical Reads
Treat this as a coarse indicator. A “high” hit ratio does not guarantee good performance, and a “low” ratio does not automatically mean you should increase cache memory.
Calculating buffer hit ratio (modernized SQL)
Method 1: System-level ratio from V$SYSSTAT
/* System-wide since instance startup (coarse indicator) */
SELECT
  ROUND(
    100 * (1 - (SUM(CASE WHEN name = 'physical reads' THEN value END)
              / NULLIF(
                  SUM(CASE WHEN name = 'db block gets' THEN value END)
                + SUM(CASE WHEN name = 'consistent gets' THEN value END),
                0
                )
              )
         ),
    2
  ) AS buffer_hit_ratio_pct
FROM v$sysstat
WHERE name IN ('physical reads', 'db block gets', 'consistent gets');
Method 2: Display supporting counters (logical/physical)
SELECT
  SUM(CASE WHEN name = 'db block gets'     THEN value END) AS db_block_gets,
  SUM(CASE WHEN name = 'consistent gets'  THEN value END) AS consistent_gets,
  SUM(CASE WHEN name = 'physical reads'   THEN value END) AS physical_reads,
  ROUND(
    100 * (1 - (SUM(CASE WHEN name = 'physical reads' THEN value END)
              / NULLIF(
                  SUM(CASE WHEN name = 'db block gets' THEN value END)
                + SUM(CASE WHEN name = 'consistent gets' THEN value END),
                0
                )
              )
         ),
    2
  ) AS buffer_hit_ratio_pct
FROM v$sysstat
WHERE name IN ('db block gets', 'consistent gets', 'physical reads');
Short-interval buffer cache insight (preferred over “since startup”)
A major problem with the classic buffer hit ratio is that V$ cumulative counters reflect activity
since instance startup. For “right now” diagnostics, use short-interval metrics and SQL-level instrumentation.
Two practical approaches:
- Use V$SYSMETRIC / V$SYSMETRIC_HISTORY to view recent rolling metrics (minute-scale).
-
Compute deltas from
V$SYSSTATover a fixed interval (for example, 5 minutes) and calculate the ratio from the delta values.
What to tune instead of buffer hit ratio
When the workload involves full-table scans (or you suspect they are contributing to slowdowns), focus on these more actionable items:
- SQL access paths: confirm whether scans are expected by reviewing execution plans.
- Physical I/O profile: identify scan-related waits (for example, scattered read vs direct path read patterns).
- Statistics quality: stale stats and skew lead to misestimates and surprising full scans.
- Segment design: partitioning, clustering, and compression can reduce scanned data volume.
If you do adjust memory, use modern memory management rather than historic init.ora-era “increase
db_block_buffers” guidance. In current releases, buffer cache sizing is typically managed through
automatic memory management or explicit SGA component sizing (for example, SGA_TARGET,
MEMORY_TARGET, DB_CACHE_SIZE).
Index clustering factor
For B-tree indexes, clustering factor helps the optimizer estimate whether index access will be efficient or whether a scan is cheaper. A low clustering factor means table rows are physically well-ordered with respect to the index key, which usually favors index range scans. A high clustering factor implies row locations are scattered, which can favor full scans when many rows are needed.
Clustering factor is an index property, not a table property. Improving one index’s clustering can harm another. This is why you validate changes by reviewing execution plans and measuring workload impact.
Summary
- A full-table scan reads formatted blocks up to the HWM and filters rows during the scan.
- Full scans are often appropriate; the tuning task is identifying unexpected scans.
- Buffer hit ratio is a coarse, legacy indicator and is not a reliable tuning target for scan-heavy workloads.
- In Oracle 23ai, measure access paths and I/O behavior directly (plans, SQL stats, waits), then act on indexes, stats, and design.
In the next lesson, we will examine adding data buffers and how memory choices affect different workload patterns.