| Lesson 5 | Database deadlocks |
| Objective | Identify an Oracle deadlock |
Identifying Deadlocks in Oracle: Methodologies and Best Practices
In Oracle's Relational Database Management System (RDBMS), the locking mechanism plays a pivotal role in maintaining database integrity, especially during concurrent transactions. However, in the complex tapestry of database interactions, deadlocks can occur, severely impacting database performance and transactional integrity. Detecting these deadlocks is a critical responsibility for an Oracle Database Administrator (DBA). This document outlines the methodologies and tools available for identifying Oracle deadlocks.
- Alert Log:
The first line of defense in identifying a deadlock is Oracle's alert log. Oracle automatically detects deadlocks and resolves them by rolling back one of the transactions involved. Detailed information about the deadlock, including the involved sessions and SQL statements, is written to the alert log.
- Location: The alert log can generally be found in the `alert_<SID>.log` file within the Oracle Diagnostic Destination directory.
- Content: The log contains a 'Deadlock detected' message and provides trace file references for deeper investigation.
- Trace Files:
When a deadlock occurs, Oracle generates specific trace files for each session involved. These files contain detailed information, such as SQL statements and locking resources, that led to the deadlock.
- Location: Usually in the `trace` directory under the Oracle Diagnostic Destination.
- Analysis: Examine the trace files to understand the deadlock sequence, SQL queries involved, and locking objects.
- Dynamic Performance Views:
Oracle provides various Dynamic Performance Views (V$ views) that can be queried to identify potential deadlocks:
- V$LOCK: Shows all locks held or requested by Oracle sessions.
- V$SESSION: Provides information about each current session, including any locks held.
Example SQL query to identify sessions waiting on locks:
SELECT
    a.session_id,
    b.object_name,
    a.locked_mode,
    a.oracle_username
FROM
    v$locked_object a,
    dba_objects b
WHERE
    a.object_id = b.object_id;
- Deadlock Graphs: Oracle trace files and even some third-party tools can generate deadlock graphs, which visually represent the locking dependencies among transactions. Understanding the deadlock graph can help you pinpoint the issue at its core.
- Advanced Monitoring Tools: Advanced monitoring solutions like Oracle Enterprise Manager (OEM) also provide deadlock detection features. These tools offer real-time monitoring and alerting capabilities and can often be configured to trigger automatic actions, such as sending alerts to administrators.
- Programmatic Detection: PL/SQL or Oracle’s Java-based stored procedures can be utilized to programmatically check for lock conditions, although this is generally not recommended due to the performance overhead it may impose. Identifying deadlocks is an essential aspect of maintaining an Oracle database's performance and integrity. Utilizing alert logs, trace files, Dynamic Performance Views, and advanced monitoring tools is critical for effective deadlock identification and resolution. Being well-versed in these methodologies and tools is indispensable for any Oracle DBA tasked with ensuring seamless database operations and transactional integrity.
Oracle locking Scenario
The purpose of the Oracle locking scenario insures that all database integrity is maintained and that updates do not inadvertently overlay prior updates to the database. However, a penalty has to be paid for maintaining shared locks.
- Lock Space Considerations: In Oracle, each lock requires 4 bytes of RAM storage within the Oracle instance storage pool, and large SQL SELECT statements can create SOS (short on storage) conditions that can cripple the entire database. For example, a SELECT statement that retrieves 1,000 rows into the buffer will require 4,000 bytes of lock space.
- Oracle Deadlock: Multiple competing tasks can also cause a condition called the "deadly embrace," or a database deadlock. A deadlock condition occurs when two tasks are waiting on resources that the other task has locked. The following series of images shows how a deadlock develops.
Database Deadlock Occurence
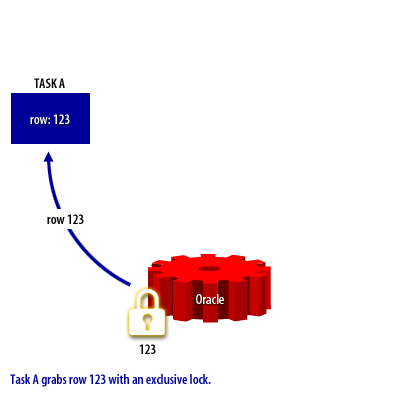
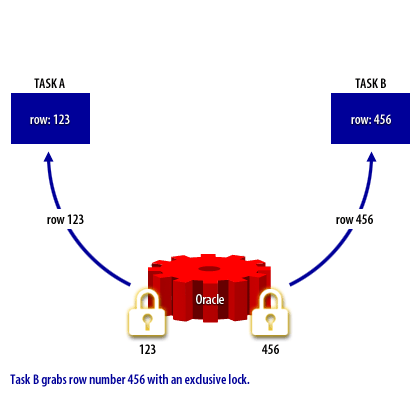
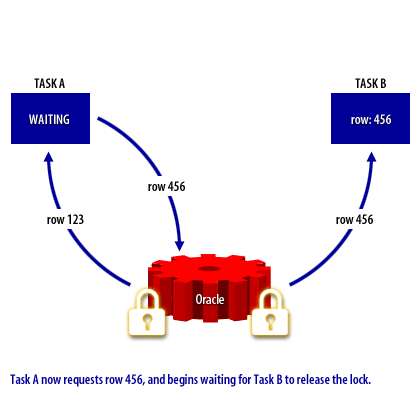
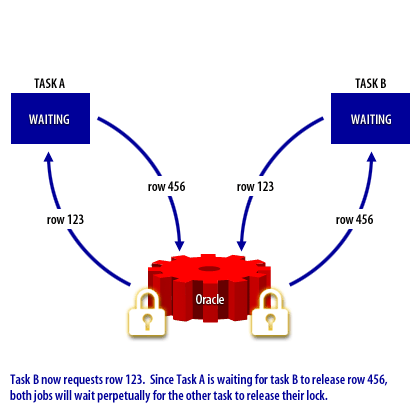
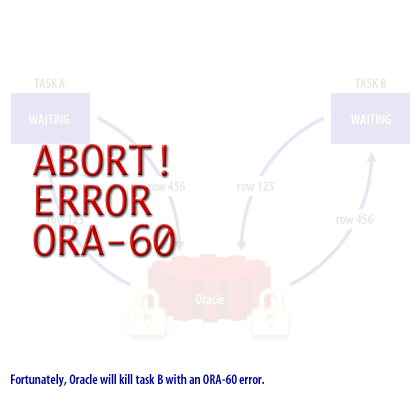
Oracle releases Database Deadlock
In reality, of course, Oracle will release the database deadlock by aborting the task that caused the deadlock, in this case task A. Oracle's Lock Manager will detect the deadly embrace after a task has been waiting and will abort the task with the ORA-60 "deadlock detected while waiting for resource" message. Remember that it is impossible for a single task to cause a deadlock and two tasks must be involved. Now that you know what a deadlock is, the next lesson will show you how to prevent it from happening.
abort error ORA-60 in Oracle RDBMS
The "abort error ORA-60" in Oracle RDBMS refers to a "deadlock detected" error. This occurs when two or more sessions are waiting for resources (such as rows or table locks) held by each other, creating a cyclic dependency that cannot be resolved, which results in a deadlock.
ORA-00060 Error Description: The full error message looks something like this:
When does this happen?
The ORA-00060 error occurs when two sessions hold locks on rows or tables, and each session is waiting for the other to release its lock. Oracle automatically detects such deadlocks and terminates (or aborts) one of the transactions to resolve the issue. The session that receives the ORA-60 error will have its transaction rolled back.
Example Scenario:
Since the deadlock cannot be resolved, Oracle will detect it and abort one of the transactions by issuing an ORA-00060 error. The other session can continue.
Key Points:
How to Avoid ORA-00060:
In Oracle, the ORA-00060 error is a common symptom of concurrent transaction issues and can be resolved by analyzing the application logic and ensuring proper transaction handling.
ORA-00060 Error Description: The full error message looks something like this:
ORA-00060: deadlock detected while waiting for resource
When does this happen?
The ORA-00060 error occurs when two sessions hold locks on rows or tables, and each session is waiting for the other to release its lock. Oracle automatically detects such deadlocks and terminates (or aborts) one of the transactions to resolve the issue. The session that receives the ORA-60 error will have its transaction rolled back.
Example Scenario:
- Session 1 locks row A and then tries to lock row B.
- Session 2 locks row B and then tries to lock row A.
Both sessions are now waiting for each other to release the lock, creating a cyclic dependency (deadlock).
Since the deadlock cannot be resolved, Oracle will detect it and abort one of the transactions by issuing an ORA-00060 error. The other session can continue.
Key Points:
- Resource Contention: The error happens due to resource contention, where multiple sessions are trying to acquire locks on the same resources in a conflicting manner.
- Automatic Detection: Oracle RDBMS has an internal mechanism to automatically detect deadlocks and abort one of the sessions involved in the deadlock to resolve the situation.
- Transaction Rollback: The session that receives the ORA-00060 error will have its transaction rolled back to maintain data integrity.
- Common Causes:
- Poor application design, where transactions access resources in different orders across multiple sessions.
- Long-running transactions that hold locks for extended periods, increasing the chances of contention.
How to Avoid ORA-00060:
- Ensure consistent locking order: All transactions should acquire locks in the same order.
- Use shorter transactions: Minimize the time transactions hold locks to reduce the possibility of a deadlock.
- Check for proper indexing: Ensure that the tables involved in the transactions are properly indexed, which can reduce lock contention.
In Oracle, the ORA-00060 error is a common symptom of concurrent transaction issues and can be resolved by analyzing the application logic and ensuring proper transaction handling.