| Lesson 3 | Describe the features of the OEM 24ai Console |
| Objective | Areas of OEM administration in 24ai |
Oracle Enterprise Manager 24ai Console
The classic OEM Console, a Java-based thick client, organized everything into four panes: a Navigator pane for the hierarchical structure of databases and services, a Map pane for a graphical layout of networked Oracle nodes, a Job pane for scripts and OS commands, and an Event pane for outstanding alerts and logs. That interface was deprecated as Oracle moved to a web-based console starting with 10g, and it has no place in current Oracle Enterprise Manager at all, the current release is EM 24ai, not the 13c line some older material still points to as "current."
What actually replaced each of those four panes is the substance of this lesson.
| Classic OEM Console | Oracle Enterprise Manager 24ai |
| Java-based thick client GUI | Web-based, JET-based interface |
| Local monitoring per database | Centralized, enterprise-wide monitoring |
| Basic job and event handling | Advanced diagnostics, patching, and automation |
| Limited scalability | Cloud and hybrid infrastructure monitoring at fleet scale |
What actually replaced each of those four panes is the substance of this lesson.
Enterprise Manager 24ai Administration
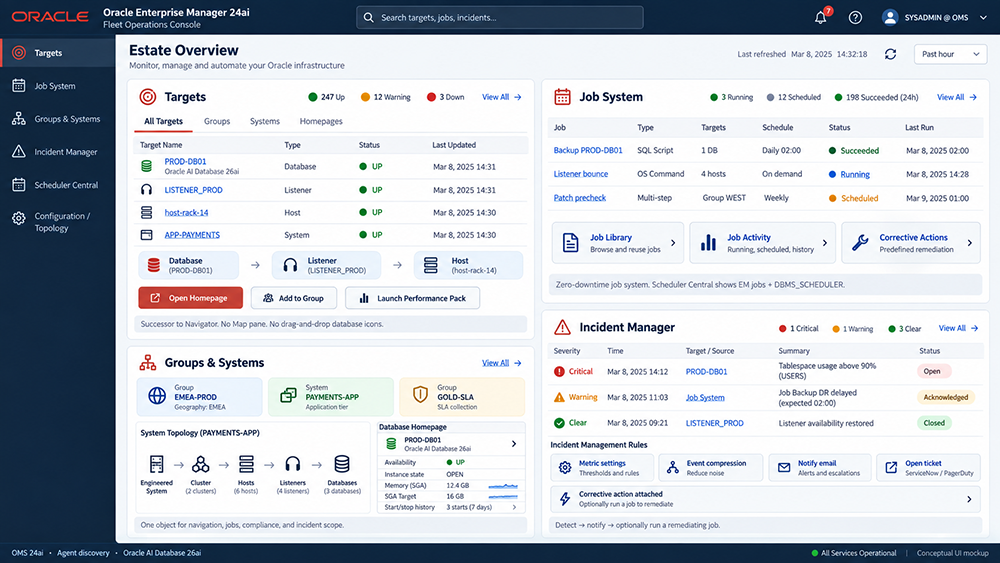
From that high-level view, EM 24ai administration concentrates on four areas that between them replace the old console's four panes:
01 Targets and navigation
02 The Job System
03 Groups, systems, and topology
04 Events and Incident Manager
Targets and Navigation
Use Targets, All Targets, Groups, Systems, and individual target homepages, to find databases, listeners, hosts, and other managed objects, see how they relate to each other, open a target and run administrative tasks from its homepage, place targets into groups or systems for fleet-wide operations, and launch integrated tools from the target's own context (performance, configuration, security, and other packs as licensed).
This is the successor to the Navigator, not a Schema Manager clone built into the console. Schema and object-level work belongs in the database tools on the target homepage, or in SQL Developer or SQLcl against Oracle AI Database 26ai directly. There's no dragging a database icon onto a Map pane anymore.
Note: EM 24ai doesn't read
This is the successor to the Navigator, not a Schema Manager clone built into the console. Schema and object-level work belongs in the database tools on the target homepage, or in SQL Developer or SQLcl against Oracle AI Database 26ai directly. There's no dragging a database icon onto a Map pane anymore.
Note: EM 24ai doesn't read
topology.ora or anything resembling the old Net8-era client-side topology generator. Targets appear after agent-based or guided discovery against the Oracle Management Service; connection details live in EM itself and in the database's own network configuration, not in a file on a client PC.
The Job System
The Job System runs work across databases, groups, systems, listeners, and hosts. From Job Activity and the job library, you create, schedule, cancel, monitor, and review the history of jobs, immediately, once, or on a repeating schedule, against one target or many. Predefined job types cover common tasks; custom OS and SQL scripts, including multi-step jobs, cover the rest. Corrective actions attach a job directly to an event, so EM can attempt an automatic fix when a condition is detected.
In-database schedules still use Oracle Scheduler (
In-database schedules still use Oracle Scheduler (
DBMS_SCHEDULER) on 26ai, unchanged; Scheduler Central in EM is where you see both EM's own jobs and database maintenance jobs together in one place. EM 24ai also adds job diagnostics dashboards and a zero-downtime job system, so maintenance on EM itself doesn't interrupt job execution.
Groups, Systems, and Topology
There's no Map window in current EM. Instead, create Groups and Systems when you need a saved view of part of your estate, membership can follow any operational criterion you want, geography, application, lifecycle stage, or SLA tier, and then run operations once against the whole collection instead of against each member individually.
For a large estate, this is the actual replacement for the old map: one object that covers navigation, jobs, compliance, and incident scope together. Target homepages replace the old "double-click the map icon" instance snapshot; a database homepage shows availability, instance state, memory metrics, and start-related history directly. Start and stop remain privileged actions run from the target menu or a job, not a special Map dialog. Configuration and topology pages separately show how a target relates to hosts, listeners, clusters, and engineered systems.
For a large estate, this is the actual replacement for the old map: one object that covers navigation, jobs, compliance, and incident scope together. Target homepages replace the old "double-click the map icon" instance snapshot; a database homepage shows availability, instance state, memory metrics, and start-related history directly. Start and stop remain privileged actions run from the target menu or a job, not a special Map dialog. Configuration and topology pages separately show how a target relates to hosts, listeners, clusters, and engineered systems.
Events and Incident Manager
Events are the detected conditions themselves, metric thresholds, availability changes, job status, and similar. Incident Manager is where you actually work those events as incidents. You define metric settings and incident rules rather than the old "event sets": rules control who gets notified, whether related events compress into a single incident, and whether a corrective action runs automatically. Notifications include email and other methods, and connectors can open tickets directly in systems like ServiceNow or PagerDuty.
Graphical badges and incident lists on target and group pages replace drawing the event on the old console map, but the operational pattern itself hasn't changed from the original Event Manager plus fixit-job model: detect, notify, and optionally run a job to remediate.
Graphical badges and incident lists on target and group pages replace drawing the event on the old console map, but the operational pattern itself hasn't changed from the original Event Manager plus fixit-job model: detect, notify, and optionally run a job to remediate.
Walking Through a Real Incident, End to End
The four administration areas aren't really four separate tools, they're four stages of the same workflow, and seeing them work together makes each one's purpose clearer than describing them in isolation does. Say a tablespace on a production database crosses 90% utilization.
- A metric threshold defined against that target fires, and Incident Manager opens a new incident at Critical severity, exactly the kind of event the old Event pane would have flagged, now with the rule that generated it visible right alongside the incident itself.
- Incident management rules determine what happens next: the responsible team gets notified by email, and if a corrective action is attached to that rule, EM can automatically kick off a remediation job, adding space to the tablespace, for instance, without anyone needing to open the console first.
- That remediation runs through the Job System, visible in Job Activity alongside every other scheduled and on-demand job, with its own status and history, whether it was triggered automatically or run by hand.
- Once resolved, the incident's status updates, and everything about it, the original metric, the rule that fired, the job that ran, the target it happened on, stays attached to that target's own homepage under Targets, so the full history is still there the next time anyone looks at that database.