Using Logging and Tracing to Troubleshoot the Network Environment
Understanding Oracle's scheme for logging and tracing is necessary in order to fully understand and troubleshoot any Oracle Net Services problem. A client-side connection failure typically surfaces as a single terse error, an ORA-12154 or an ORA-12541 for example, but that one line is only the top of a much longer error stack. The two errors even point in different directions: ORA-12154 means the client could not resolve the connect identifier it was given, a naming problem, while ORA-12541 means the address resolved fine but nothing was listening there, a connectivity problem one network hop further along. Telling those two situations apart, and the many others like them, is exactly what logging and tracing exist to do.
Connection failures, redirects, timeouts, and load-balancing decisions span the client, the listener, Oracle Connection Manager (if one is in the path), and the database server, and only the logs and trace files kept by each of those components show which layer actually failed and what was exchanged along the way.
In this module, you will look at the basic environmental information, such as the purposes and locations of log and trace files. The module will conclude with a discussion of how trace files are used to resolve a network services problem.
Learning Objectives
After completing this module, you will be able to:
List the type of information that is contained in the log and trace files
Describe where the Oracle log and trace files are located
Alter the log and trace file locations
Modify and customize the log and trace file contents
Why Logging and Tracing Matter
Logging records significant network events: connection requests, service registrations, administrative commands, and the error stacks produced when something goes wrong. Tracing goes a level deeper: it records the actual packet-level flow of a session between two network components, which is what lets you see exactly where in the conversation a connection stalled or was refused.
Every Oracle Net Services component keeps its own log and, when enabled, its own trace:
The listener logs connection requests, service registrations, and control commands to its log file.
The client and server each maintain a sqlnet.log.
Oracle Connection Manager (CMAN) keeps logs for its listener, its CMGW gateway processes, and its CMADMIN administrative process.
Because each component only sees its own side of the conversation, a single connection problem can require looking at several logs together before the actual point of failure becomes clear. A client-side sqlnet.log entry showing a failed connection attempt, for instance, tells you the client gave up; it will not tell you whether the listener never received the request, received it and rejected it, or received it and successfully handed it off to a server process that then failed independently. That is the kind of question only tracing, or a cross-check against the listener's own log, can answer.
Logging is lightweight enough to leave enabled continuously. Tracing is not: it adds measurable overhead to every network round-trip, so the normal pattern is to enable it, reproduce the problem, and then turn it back off, rather than running it as a permanent configuration.
Understanding the Oracle Net Error Stack
When an application surfaces a one-line network error, Oracle Net has typically already assembled a more detailed error stack describing which internal layer detected the problem. The stack is built from three primary layers:
NI: Network Interface, the uppermost layer
NS: Network Session
NT: Network Transport, which sits just above the operating system's own network protocol stack
The NI and NS layers together make up what Oracle calls the Net Foundation Layer, while NT belongs to a separate Protocol Support layer that interfaces directly with the operating system's networking stack. A related layer, NA (Network Authentication), can also appear in the stack as part of session-layer security processing.
Reading an error stack from the top down tells you whether a failure originated in session negotiation (NS), in the underlying transport (NT), or elsewhere, a level of detail a bare ORA-12541 on its own does not give you. A typical stack looks roughly like this, with an error code reported at each layer the request passed through before failing:
ns main err code: 12541
ns secondary err code: 12560
nt main err code: 511
nt secondary err code: 61
nt OS err code: 0
Here, the NS layer's codes point to "no listener" (12541/12560), while the NT layer's codes narrow it down further to a connection refused at the operating system socket level (511/61), the kind of detail that turns "it does not connect" into "nothing is listening on that port."
Understanding Oracle Net Logging
Logging parameters are set per component, the same way tracing parameters are: LOG_DIRECTORY_* and LOG_FILE_* in sqlnet.ora, listener.ora, and cman.ora control where each component's log is written and what it is named. For the listener specifically, the LOGGING_LISTENER parameter can be set to OFF to disable listener logging entirely, though leaving it on is the normal recommendation since the overhead is minimal and the log is often the first place you look when a connection problem is reported.
A listener log entry typically records a timestamp, the connecting host, the service or SID requested, the command or connect data involved, and a return code, usually enough on its own to tell you whether the listener ever saw the request at all and, if so, why it rejected it.
Automatic Diagnostic Repository (ADR)
Since DIAG_ADR_ENABLED defaults to ON, Oracle Net Services diagnostics are collected into the Automatic Diagnostic Repository (ADR) by default, for the listener, for each Oracle Connection Manager instance, and for the client and server. Rather than writing a single flat trace file per component, ADR organizes incidents and diagnostic data under a structured $ADR_BASE/diag/... hierarchy, keyed by product and instance name, alongside a log.xml for each component.
You can still configure classic, non-ADR-style logging and tracing, using the same parameter and trace file names covered elsewhere in this lesson, by setting DIAG_ADR_ENABLED=OFF in the relevant configuration file: sqlnet.ora for the client or server, or the listener-specific DIAG_ADR_ENABLED_listener_name parameter in listener.ora. Most environments leave ADR enabled and use the adrci utility for incident review, but the classic file names and locations discussed in this lesson remain fully supported and are still what you will see referenced in trace output and support documentation.
Each ADR-managed component, including the listener and every Oracle Connection Manager instance, gets its own ADR home under a shared ADR_BASE, identified by the component type and instance name. From adrci, the SHOW BASE command (for example, SHOW BASE -product client) reports the current ADR_BASE directory, which you then supply to SET BASE to point the utility at the right homes before querying incidents. Beyond browsing individual trace entries, adrci can also package a problem's incident and diagnostic information into a single zip file, the form in which Oracle Support Services typically wants it, rather than a raw trace file.
Understanding Oracle Net Services Trace File Names
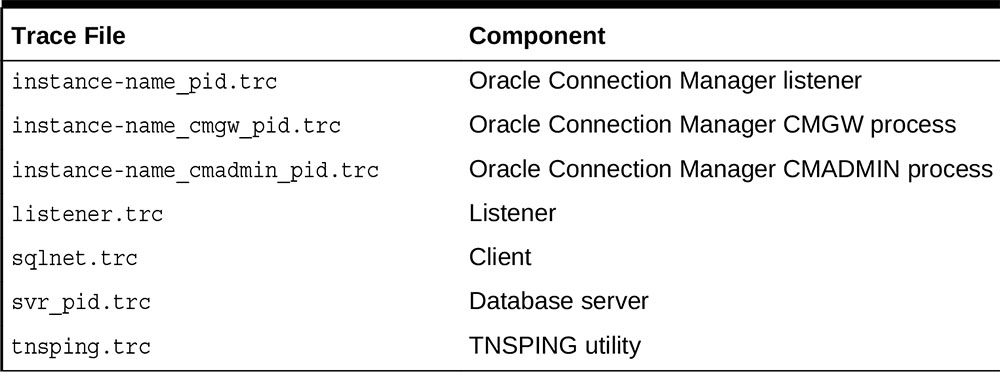
Each Oracle Net Services component produces its own trace file. Table 7-1 provides the default trace file names and lists the components that generate the trace files.
Table 7-1 Trace Files Names
Trace File
Component
instance-name_pid.trc
Oracle Connection Manager listener
instance-name_cmgw_pid.trc
Oracle Connection Manager CMGW process
instance-name_cmadmin_pid.trc
Oracle Connection Manager CMADMIN process
listener.trc
Listener
sqlnet.trc
Client
svr_pid.trc
Database server
tnsping.trc
TNSPING utility
By default, trace files are written to the network/trace subdirectory of the relevant Oracle home. When a trace file reaches its configured size limit, Oracle Net distinguishes successive files by sequence number: for example, listener1.trc, listener2.trc, and listener3.trc.
Setting Trace Levels
Tracing parameters are set per component, in sqlnet.ora for the client and server, in listener.ora for the listener, and in cman.ora for Oracle Connection Manager, using the parameters TRACE_LEVEL_*, TRACE_DIRECTORY_*, and TRACE_FILE_*.
Each component accepts a trace level between 0 and 16, or one of four named levels:
off: no tracing (equivalent to 0)
user: traces user-induced error conditions (equivalent to 4)
admin: traces installation-specific problems
support: full detail for Oracle Support Services (equivalent to 16)
The admin level is the one place where the three components disagree: for the listener and for the client/server (sqlnet.ora), admin is equivalent to 6; for Oracle Connection Manager (cman.ora), admin is equivalent to 10. If you are translating between the named level and a numeric TRACE_LEVEL_* setting, use the value that matches the component you are configuring rather than assuming a single number applies everywhere.
A minimal client-side sqlnet.ora entry to enable support-level tracing, for example, looks like this:
The equivalent server-side and listener-side parameters follow the same pattern with _SERVER and _LISTENER suffixes. In cman.ora, the parameters drop the component suffix entirely, since the file already applies only to Oracle Connection Manager:
TRACE_LEVEL = support
TRACE_DIRECTORY = /oracle/network/trace
TRACE_FILE = cman
As with the trace files themselves, once a trace file reaches its configured size limit, Oracle Net rolls over to a new file distinguished by sequence number rather than overwriting the existing one.
If a single host runs more than one listener, name them distinctly in listener.ora and include the listener name on every command, including trace commands; parameters set without a listener name apply to a listener named LISTENER by default, and two unnamed listeners sharing a host will otherwise contend for the same trace and log file names.
Setting Tracing Dynamically with LSNRCTL
Rather than editing listener.ora directly, you can set or change the listener's trace level at runtime from the Listener Control utility.
TRACE Listener Purpose: To set tracing for the listener.
Syntax: From the operating system:
lsnrctl trace level listener_name
From the Listener Control utility:
LSNRCTL> trace level listener_name
Arguments level: One of the following trace levels:
off for no trace output
user for user trace information
admin for administration trace information
support for Oracle Support Services trace information
listener_name: Specify the listener name, if the default name of LISTENER is not used.
Usage Notes: This command has the same effect as the SET TRC_LEVEL command. The related commands SET TRC_DIRECTORY and SET TRC_FILE let you change the destination directory and file name for listener trace output without restarting the listener, and SAVE_CONFIG writes the current trace level, trace file, trace directory, and logging settings back to listener.ora so they persist across the next listener restart. Oracle Connection Manager has an equivalent control utility, CMCTL, for changing CMAN trace settings at runtime.
Example:
LSNRCTL > TRACE ADMIN lsnr
Connecting to (ADDRESS=(PROTOCOL=TCP)(HOST=sales-server)(PORT=1521))
Opened trace file: /oracle/network/trace/listener.trc
The command completed successfully
A Practical Troubleshooting Workflow
Putting the pieces of this lesson together, a typical network troubleshooting pass follows roughly this sequence:
Confirm basic reachability with tnsping before assuming the problem is inside the database itself; a failure here points you at the network layer immediately.
Check the listener's status and registered services with lsnrctl status and lsnrctl services, to rule out a stopped listener or a service that never registered.
If the listener looks healthy but the connection still fails, raise tracing to at least the user level on the component closest to where you suspect the failure, whether that is the client, the listener, or Connection Manager, and reproduce the problem.
Read the resulting trace from the top down, using the NI/NS/NT error stack to identify which layer reported the failure, and cross-reference it against the corresponding log file for additional context, such as timestamps, requested service, and return codes.
Once the cause is identified, turn tracing back off. Leaving a high trace level enabled after troubleshooting is finished adds ongoing overhead for no benefit.
Taken together, the log and trace files described in this lesson, read against the layered error stack, are usually enough to turn a one-line ORA- error into a specific, correctable cause: a missing listener, a misconfigured service name, a blocked port, or a rule rejecting the connection outright.
Common Causes of Network Connection Failures
Most Oracle Net connection problems trace back to a handful of recurring causes, and knowing the usual suspects in advance narrows the search considerably before you even open a trace file:
Listener not started or not registered. If the database instance has not registered its service with the listener, perhaps because the instance was started before the listener, or because local_listener is misconfigured, the service simply will not appear in lsnrctl services output.
Misconfigured naming. A tnsnames.ora entry with the wrong host, port, or service name produces an ORA-12154 before the client ever reaches the network; this is a client-side naming problem, not a listener problem, and the client-side trace will show the failure occurring before any connection to the remote host is even attempted.
Firewall or network access control blocking the port. A blocked port, or an Oracle Connection Manager access control rule set to reject or drop, produces a connection timeout or an immediate refusal depending on which device is doing the blocking; comparing the client trace against the listener or CMAN log quickly shows whether the request ever arrived.
Service name versus SID confusion. Connecting with a SID when the listener is only registered under a service name, or the reverse, produces an ORA-12514 or ORA-12505 rather than ORA-12541, since the listener was reachable but did not recognize what was being asked for.
Matching the specific error code and the layer it was reported at, NI, NS, or NT, against this list is usually enough to point you at the right configuration file before you need to enable tracing at all. Tracing becomes most valuable for the cases that do not fit neatly into this list: intermittent failures, timing-dependent load-balancing behavior, or problems that only appear under concurrent connection load.
The next lesson presents an overview of the log and trace files themselves: what each one contains and how to read it.