| Lesson 4 | Locked resources |
| Objective | Monitor SQL Server locks. |
Monitor SQL Server Locks
When a connection accesses data, SQL Server uses a lock[1] to control access to that data. Locks are how SQL Server enforces transaction isolation levels and protects data integrity under concurrent access. In most cases they are invisible and cause no trouble at all, but occasionally, as the previous lesson covered, a process holding a lock blocks other processes from accessing the same data. Finding out what is locked, and what kind of lock is being held, is done with Transact-SQL, specifically the Dynamic Management Views that SQL Server 2025 exposes for exactly this purpose.
A Quick Refresher: Identifying the Connection
Before looking at what is locked, it helps to know which connection is doing the locking. That is exactly what
Running
sp_who, covered two lessons ago, provides: the session process ID (spid), status, login name, host name, the blk blocking indicator, database name, and current command.
Running
EXEC sys.sp_who; against a SQL Server 2025 instance might return, for example, three sessions: session 61, sleeping, logged in as app_user, with blk at 0; session 62, suspended, logged in as report_user, with blk at 61; and session 63, running, logged in as analyst, with blk at 0. Session 62 is blocked by session 61, exactly the kind of situation where the natural next question is what lock session 61 is actually holding, and what session 62 is waiting on. That is where lock-level monitoring, the subject of this lesson, picks up.
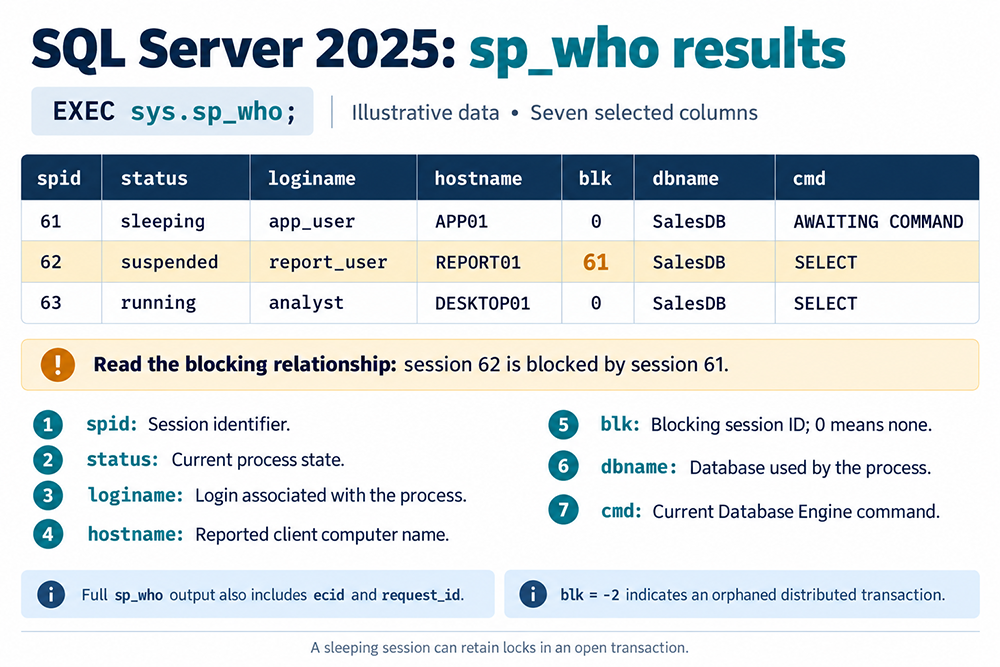
- The System Process Identifier (spid) uniquely identifies an active connection to SQL Server.
- Identifies the status of the program.
- Loginname identifies the SQL Server login or Windows NT login that is connected.
- Hostname identifies the computer from which the connection was made.
- Blk indicates if the process is blocked by another process. A zero means that the process is not blocked and any other number identifies the process that is holding the lock.
- Dbname identifies the database that you are logged in to.
- Cmd provides a high-level understanding of what the process is currently doing.
For anyone who wants a single, richer alternative to
sp_who for this kind of investigation, Adam Machanic's free, widely used sp_WhoIsActive script is worth knowing about. It is not a Microsoft-shipped procedure, so it has to be downloaded and installed into the instance separately, but it combines session, blocking, wait, and query-text information that would otherwise take several separate DMV queries to assemble by hand. For a DBA who does this kind of investigation routinely, that single-script convenience is a real time saver, even though everything it reports can also be pulled directly from the underlying DMVs this lesson and the previous one cover.
sp_lock: A Deprecated Starting Point
Older SQL Server content, including earlier versions of this lesson, points to the
Called with no parameters,
returns lock information for every process on the instance. Called with one or two spids, it limits the results to those specific sessions.
sp_lock system stored procedure for viewing current locks. Its syntax is as follows:
sp_lock [[@spid1=]spid [, [@spid2=]spid]]
Called with no parameters,
sp_lock
returns lock information for every process on the instance. Called with one or two spids, it limits the results to those specific sessions.
sp_lock still runs in SQL Server 2025, and it will still return a result set if you call it. But it has been formally deprecated since SQL Server 2008, and Microsoft's own documentation recommends against using it in new work, pointing instead to sys.dm_tran_locks. It is worth recognizing sp_lock if you come across it in an older script someone else wrote, but it is not where new monitoring work should start, and the rest of this lesson will build around the modern DMV instead.
sys.dm_tran_locks: The Modern Equivalent
sys.dm_tran_locks is the current, documented, supported Dynamic Management View for seeing what is locked right now:
SELECT request_session_id, resource_type, resource_database_id,
       resource_description, request_mode, request_status
FROM sys.dm_tran_locks;
Like the other DMVs covered in this module, querying it requires
VIEW SERVER STATE permission, or membership in a role that includes it. The columns map reasonably well onto what sp_lock used to show, with more precision and clearer names:
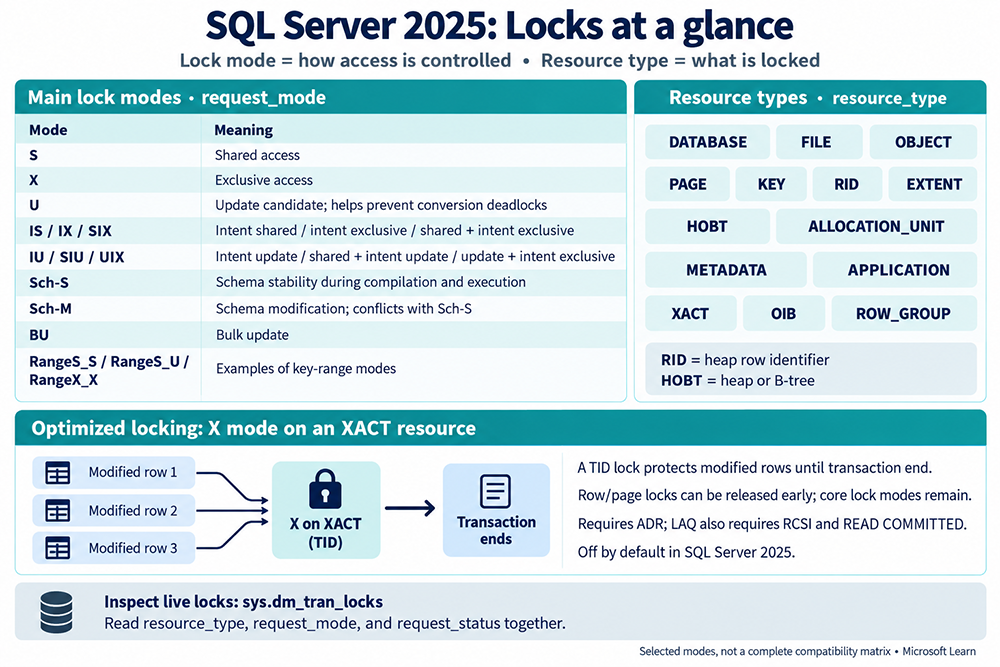
request_session_id: the spid holding or requesting the lock. Cross-reference this against the spid column fromsp_whoor Activity Monitor's Processes pane to find the login and host behind it.resource_database_id: the database ID of the object being locked, resolved to a readable name withDB_NAME().resource_typeandresource_description: what is being locked and how it is identified. Resource types you will commonly see include DATABASE, FILE, OBJECT, PAGE, KEY, RID (a heap row identifier), EXTENT, HOBT (heap or B-tree), ALLOCATION_UNIT, METADATA, APPLICATION, XACT, OIB, and ROW_GROUP.request_mode: the kind of lock in request. Lock modes include S (shared), X (exclusive), U (update, which helps prevent conversion deadlocks), the intent modes IS, IX, and SIX, the related IU, SIU, and UIX modes, the schema modes Sch-S and Sch-M, BU (bulk update), and the key-range modes used under serializable isolation, such as RangeS_S, RangeS_U, and RangeX_X.request_status: GRANT for a lock that has been granted, WAIT for one still being requested, or CNVT for one being converted from one mode to another.
When looking at a database's locks, you will always see at least one lock belonging to the connection running the query itself, since even a read against
sys.dm_tran_locks takes a lock of its own. To translate an object ID back into a readable table name, run SELECT object_name(ID) against the database the lock belongs to. This works directly for an OBJECT-type resource, where the ID returned is a real object ID. For PAGE- or KEY-type resources, though, resource_associated_entity_id is typically a HOBT ID rather than a raw object ID, so it has to be joined through sys.partitions on hobt_id first to get back to the actual table. Skipping that join and feeding a HOBT ID straight into object_name() is a common mistake, and it either returns NULL or, worse, resolves to the wrong object entirely.
A Worked Example: Reading the Blocking Chain
Returning to the three-session scenario above, suppose session 62 has been sitting in the
Session 61 has an intent-exclusive lock on the table itself and an exclusive key lock already granted on a specific index row, left over from an update it has not yet committed. Session 62 is requesting an exclusive lock on that same key and sitting in
suspended state for several seconds, and a query against sys.dm_tran_locks filtered to spids 61 and 62 returns something like this:
request_session_id  resource_type  resource_description     request_mode  request_status
61                   OBJECT         (object id)               IX            GRANT
61                   KEY            (hash value)              X             GRANT
62                   KEY            (hash value)              X             WAIT
Session 61 has an intent-exclusive lock on the table itself and an exclusive key lock already granted on a specific index row, left over from an update it has not yet committed. Session 62 is requesting an exclusive lock on that same key and sitting in
WAIT status until session 61 releases it. This is the same blocking relationship sp_who's blk column and Activity Monitor's Blocked By column already pointed to, just confirmed at the level of the specific row and lock mode involved rather than inferred from session status alone. Joining the resource_description value back to an actual row usually is not necessary for day-to-day triage; knowing that session 61 holds an exclusive lock session 62 wants is normally enough to decide whether to wait, investigate session 61's transaction further, or escalate.
Lock Escalation
SQL Server does not keep issuing individual row or page locks indefinitely for a single statement. Once a transaction holds enough row-level or page-level locks on a single table, typically in the neighborhood of five thousand, though the exact threshold is dynamic and workload-dependent, the engine escalates to a single table-level (or in some cases partition-level) lock instead. Escalation reduces the memory and bookkeeping cost of tracking thousands of individual locks, but it also means a transaction that only needed a handful of rows can suddenly hold a lock that blocks everyone else from touching the table at all. A sharp jump in blocking that coincides with a large batch update or delete is often lock escalation rather than a change in query logic, and it shows up in
sys.dm_tran_locks as a single OBJECT-type row where you might have expected many KEY-type rows instead. This is one of the problems TID locking, covered next, is specifically designed to reduce.
SQL Server 2025's Optimized Locking
The most significant change to how locking behaves in SQL Server 2025 is a feature called Optimized Locking, a combination of two mechanisms: Transaction ID (TID) locking and Lock After Qualification (LAQ). Both are aimed at the same underlying problem this lesson keeps circling back to: a transaction holding locks longer, or more broadly, than it strictly needs to, and other sessions paying the price while they wait.
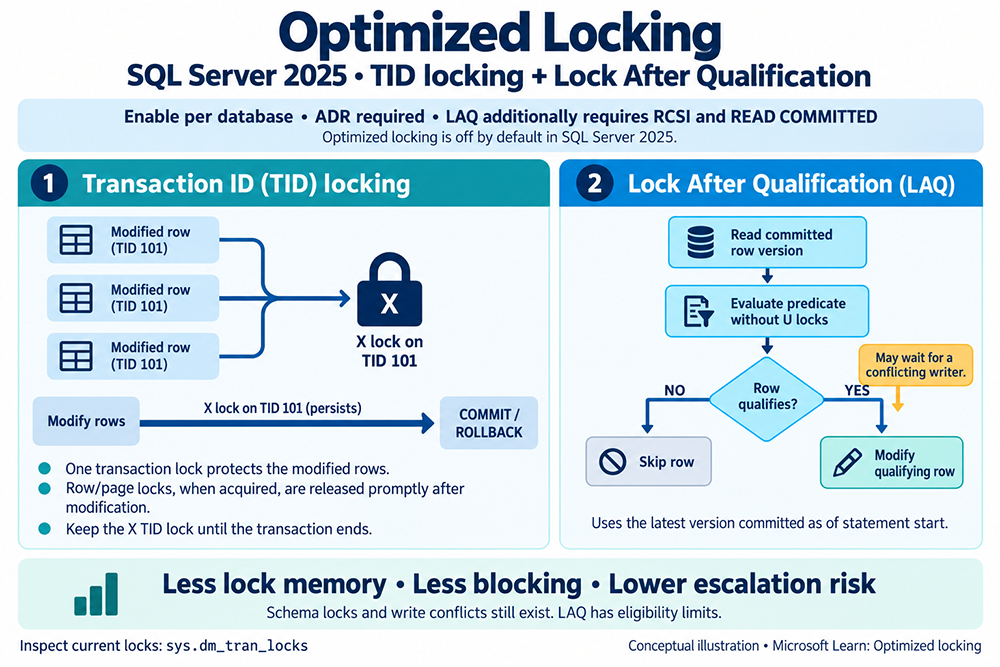
TID locking changes what a modifying transaction holds for the duration of the transaction. Instead of keeping row or page locks open on every row it changes until commit, the transaction holds a single exclusive lock on its own transaction ID, an XACT-type resource. Row and page locks are still acquired as each row is modified, but under Optimized Locking they are released promptly rather than held for the life of the whole transaction. The one TID lock persists until commit or rollback, and it is what other sessions ultimately wait on instead of a long list of individual row locks.
Lock After Qualification changes when a lock is taken in the first place, rather than what is held once it is. Under Read Committed Snapshot Isolation (RCSI), the engine evaluates a statement's predicate against the row version that was committed as of the start of the statement, without acquiring an update lock just to check whether a row qualifies. Only rows that actually qualify get locked and modified; rows that do not qualify are skipped without ever being locked at all. A row that does qualify may still have to wait on a conflicting writer, so LAQ reduces unnecessary locking rather than eliminating waits outright.
Together, TID locking and LAQ reduce the memory locks consume, reduce blocking between concurrent transactions, and lower the risk of lock escalation to a full table-level lock. They do not eliminate schema locks or genuine write conflicts, and LAQ has its own eligibility limits; not every statement shape qualifies for it. Optimized Locking requires Accelerated Database Recovery (ADR) to already be enabled on the database, and LAQ specifically also requires RCSI and the READ COMMITTED isolation level. It is off by default, including for on-premises installations, and it is turned on per database:
Whether or not Optimized Locking is enabled,
ALTER DATABASE CurrentDb SET OPTIMIZED_LOCKING = ON;
Whether or not Optimized Locking is enabled,
sys.dm_tran_locks remains the tool for inspecting what is currently locked. With Optimized Locking turned on, you will simply see fewer row and page locks and more activity concentrated on each transaction's single XACT resource, which is itself a useful signal that the feature is active and doing what it is supposed to.
Choosing the Right Tool for the Job
By this point in the module, there are several overlapping ways to look at connections and locks, and it is worth being deliberate about which one to reach for.
There is also a time dimension worth keeping separate from the resource-level view this lesson focuses on.
sp_who and sys.dm_exec_sessions answer "who is connected and what is their status." Activity Monitor's Processes pane, covered in the previous lesson, answers the same question with a live, refreshing grid instead of a one-time result set, and adds the Blocked By column that makes the blocking relationship visible at a glance. sys.dm_tran_locks answers a narrower, more specific question: exactly which resources are locked, in which mode, and by which session. None of these tools replaces the others; a typical investigation moves between them, starting broad with sp_who or Activity Monitor to spot that something is blocked, then narrowing to sys.dm_tran_locks to see precisely what the blocking session is holding.
sp_WhoIsActive, mentioned earlier, sits in between: it is not a lock-level tool the way sys.dm_tran_locks is, but because it surfaces wait information and blocking chains in one call, many DBAs reach for it before dropping down into the raw DMVs at all.
There is also a time dimension worth keeping separate from the resource-level view this lesson focuses on.
sys.dm_tran_locks shows what is locked at this instant; it says nothing about whether lock waits are a persistent pattern on the instance or a one-off. For that, sys.dm_os_wait_stats, covered back in this module's first lesson as part of Activity Monitor's resource waits, is the better tool: cumulative time spent on wait types beginning with LCK_ (LCK_M_X, LCK_M_S, and so on) tells you whether lock contention is a meaningful share of the instance's overall wait time, which is a very different question from what any single session happens to be waiting on right now.
Building Lock Monitoring Into a Routine
Lock monitoring is rarely something to do in isolation; it fits into the same proactive monitoring habit this module has been building lesson by lesson. A reasonable routine looks like this:
- Watch for blocking first, using Activity Monitor's Processes pane or a quick
sp_whocall, since that is the cheapest signal that something is worth investigating. - When blocking shows up, query
sys.dm_tran_locksfor the blocking session's spid to see exactly what it holds and in what mode, rather than guessing from the resource name alone. - Check how long the blocking session has had its transaction open. A session that has been
sleepingfor ten minutes with an uncommitted transaction is a very different situation from one that committed a second ago. - If the instance runs SQL Server 2025 and the workload is a good fit (OLTP-style, with RCSI already in use or easy to adopt), evaluate whether enabling Optimized Locking on that database would reduce how often this kind of blocking happens in the first place.
- Before deciding anything, find out what the blocking session is actually running. The
sys.dm_exec_sql_textlookup covered two lessons ago, joined againstsys.dm_exec_requestsonsql_handle, turns a bare spid into the actual statement text, which usually settles whether the transaction is almost done or stuck in a loop. - As covered in the previous lesson, use
KILLonly after confirming what the blocking transaction is doing and what rolling it back will cost, never as a first response to blocking on its own.
sp_who, watching them live in Activity Monitor, and now inspecting what they hold, working together as one coherent monitoring practice instead of three disconnected tools.
Putting It Together
Locks themselves are not a problem to be eliminated; they are how SQL Server keeps concurrent transactions from corrupting each other's work. The problem worth monitoring is locks held longer, or more broadly, than a given piece of work actually requires, which is precisely what shows up as blocking.
sys.dm_tran_locks is the modern way to see that directly, sp_lock is the deprecated tool it replaced, and SQL Server 2025's Optimized Locking is Microsoft's own answer to the same underlying problem at the engine level, holding less for less time without changing what your queries mean.
[1]Lock: A SQL Server mechanism used to enforce transaction isolation levels.