| Lesson 2 | SQL Server Profiler |
| Objective | Identify the key features of SQL Server Profiler |
Key Features of SQL Server Profiler
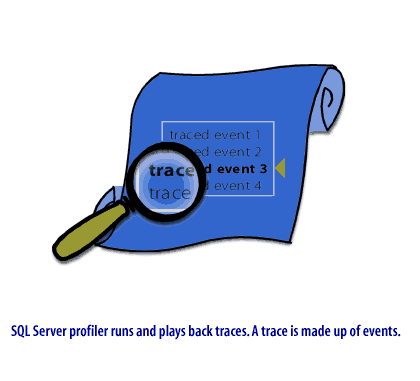
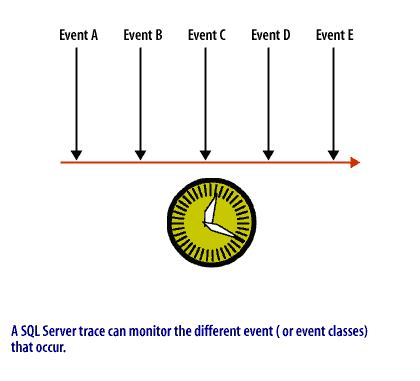
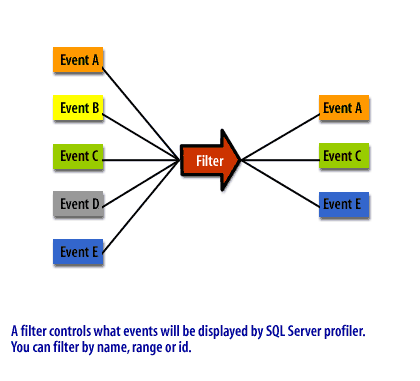
SQL Server Profiler is a graphical tool that can be used to monitor SQL Server activity. It is useful for monitoring SQL Server to see what queries are running slowly and for tuning SQL Server to improve performance. SQL Server Profiler allows you to define traces, import and export traces to files and tables, playback traces, and tune indexes with the Index Tuning Wizard. SQL Server Profiler traces are made up of events which can be filtered. You use SQL Server profiler to find out what SQL statements are causing problems. The following series of images below illustrates the tool's overall functions.
SQL Server Profiler Components


Running Microsoft Extended Events
Microsoft Extended Events is the long-term replacement for SQL Server Profiler. Extended Events is a performance monitoring tool that collects and monitors database engine actions to help diagnose problems in SQL Server. Profiler is a tool that monitors and traces SQL statements sent to SQL Server, but it has been deprecated since SQL Server 2016.
Yes, SQL Server 2019 does make use of SQL Server Profiler. It is a crucial tool for performance troubleshooting, analyzing queries, identifying bottlenecks, and understanding overall database activity. Here are some specific ways SQL Server 2019 leverages SQL Server Profiler:
Performance analysis:
Additional features:
It's important to note that while SQL Server 2019 supports SQL Server Profiler, the tool itself is no longer actively developed by Microsoft. For new features and enhancements, Microsoft recommends using Extended Events (XE) which offers improved performance and scalability. However, SQL Server Profiler remains a valuable tool for many tasks and can be readily used in SQL Server 2019.
The next lesson covers how to create a trace.
Performance analysis:
- Identify slow-running queries and optimize them for better performance.
- Analyze resource consumption by different users, applications, and processes.
- Pinpoint blocking issues and deadlocks to improve concurrency.
- Monitor database activity and identify unusual patterns.
- Capture and analyze the actual execution plan of queries.
- Understand the impact of different query optimization techniques.
- Identify inefficient joins, indexes, and other database objects.
- Test and validate changes to database schema and queries.
- Investigate errors and exceptions occurring in the database engine.
- Identify the root cause of performance problems and regressions.
- Track down security vulnerabilities and unauthorized access attempts.
- Monitor database operations during deployments, upgrades, and maintenance.
Additional features:
- Create and test plan guides for optimizing query execution.
- Replay specific sequences of events to diagnose issues.
- Export trace data to other tools for further analysis.
It's important to note that while SQL Server 2019 supports SQL Server Profiler, the tool itself is no longer actively developed by Microsoft. For new features and enhancements, Microsoft recommends using Extended Events (XE) which offers improved performance and scalability. However, SQL Server Profiler remains a valuable tool for many tasks and can be readily used in SQL Server 2019.
The next lesson covers how to create a trace.