| Lesson 9 | Trace Wizard |
| Objective | Use the Trace Wizard. |
SQL Server Trace Wizard
Unfortunately, the SQL Server Trace Wizard is no longer available in SQL Server 2022 (and even in some prior versions). Here's the breakdown:
Alternatives in SQL Server 2022
Transitioning If you have existing traces created with the Trace Wizard, you might be able to convert them into compatible Extended Events sessions. There are resources to help with this transition:
- Deprecation: Microsoft deprecated SQL Server Profiler and the associated Trace Wizard in favor of Extended Events. You'll find warnings about this in the documentation for older SQL Server versions as well.
- Why Extended Events: Extended Events provide a more lightweight, flexible, and scalable system for performance monitoring and diagnostics within SQL Server.
Alternatives in SQL Server 2022
- SQL Server Profiler: While deprecated, the SQL Server Profiler tool is still accessible in SQL Server 2022. However, it's recommended to transition to Extended Events for the long term.
- Extended Events: The primary method for tracing and diagnostics in SQL Server 2022 and future versions. You can find Extended Events in SQL Server Management Studio (SSMS).
- SSMS XEvent Profiler: A built-in graphical interface within SSMS that helps you create and manage Extended Events sessions.
Transitioning If you have existing traces created with the Trace Wizard, you might be able to convert them into compatible Extended Events sessions. There are resources to help with this transition:
The article provides an overview of Extended Events (XEvents) in SQL Server, Azure SQL Database, and Azure SQL Managed Instance. It highlights XEvents as a lightweight, configurable, and scalable system for monitoring, identifying, or troubleshooting performance. The benefits, concepts, architecture, and tasks related to Extended Events are discussed, along with the system's integration with Event Tracing for Windows (ETW) and its minimal impact on performance. The article also covers how to manage event sessions, view data, and use Extended Events for performance monitoring and troubleshooting.
While you can define your traces manually, SQL Server Profile has a Trace Wizardthat is useful for tracking down common SQL Server problems. Some of these common uses of the Trace Wizard are to:
To run the Trace Wizard, select Tools->Create Trace Wizard from SQL Server Profiler menu. This will run the Wizard.
When you run the Trace Wizard, you will get a screen for each of the trace types prompting you for the information needed to perform the selected type of trace.
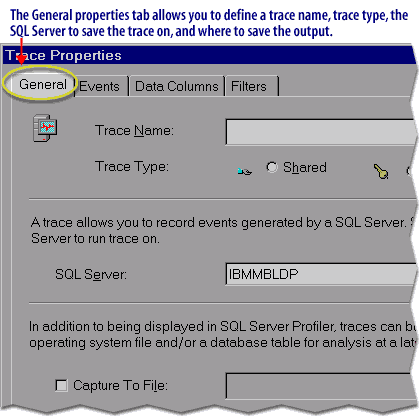
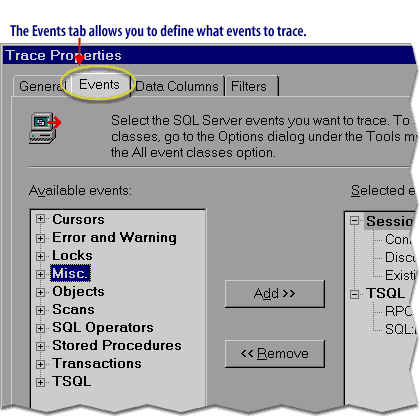
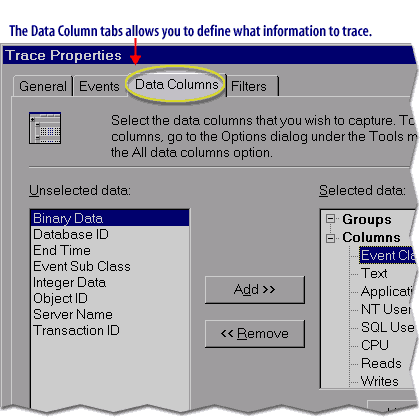
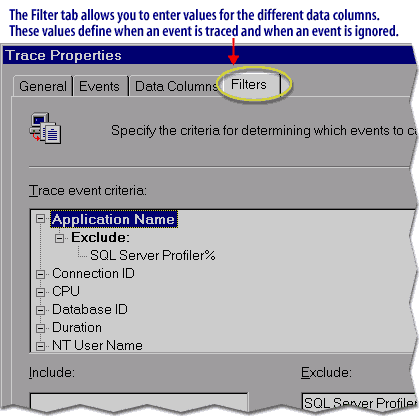
The following series of images shows you a basic overview of how the Wizard works. Note that since the screens have been altered to fit this web page, you will not be able to see all of the detail in each screen.
While you can define your traces manually, SQL Server Profile has a Trace Wizardthat is useful for tracking down common SQL Server problems. Some of these common uses of the Trace Wizard are to:
- Find the worst performing queries
- Identify scans of large tables
- Identify causes of deadlocks
- Profile the performance of a stored procedure
- Trace Transact-SQL activity by application
- Trace Transact-SQL activity by user
To run the Trace Wizard, select Tools->Create Trace Wizard from SQL Server Profiler menu. This will run the Wizard.
When you run the Trace Wizard, you will get a screen for each of the trace types prompting you for the information needed to perform the selected type of trace.
The following series of images shows you a basic overview of how the Wizard works. Note that since the screens have been altered to fit this web page, you will not be able to see all of the detail in each screen.


The next lesson will review what was presented in this module.
Trace Wizard - Quiz
Click the Quiz link below to test your knowledge of the concepts presented in this module so far.
Trace Wizard - Quiz
Trace Wizard - Quiz