| Lesson 5 | Monitoring locks with SQL-EM |
| Objective | Use SQL-EM to monitor locks. |
SQL-EM Monitor Locks
Microsoft has deprecated SQL Enterprise Manager (SQL-EM) in SQL Server 2017 and later versions. Instead, Microsoft recommends using the following tools to monitor locks:
SSMS provides a graphical user interface (GUI) for monitoring locks. You can use SSMS to view a list of all current locks, as well as the details of each lock, such as the type of lock, the object being locked, and the process that is holding the lock.
SQL Server Profiler is a tool that can be used to capture and trace database events. You can use SQL Server Profiler to trace lock events and view the details of each lock, such as the type of lock, the object being locked, and the process that is holding the lock. SQL Server Extended Events is a feature that allows you to collect and monitor database events. You can use SQL Server Extended Events to create extended event sessions that collect lock events. You can then view the details of the collected lock events in the Extended Events Explorer.
- SQL Server Management Studio (SSMS)
- SQL Server Profiler
- SQL Server Extended Events
SSMS provides a graphical user interface (GUI) for monitoring locks. You can use SSMS to view a list of all current locks, as well as the details of each lock, such as the type of lock, the object being locked, and the process that is holding the lock.
SQL Server Profiler is a tool that can be used to capture and trace database events. You can use SQL Server Profiler to trace lock events and view the details of each lock, such as the type of lock, the object being locked, and the process that is holding the lock. SQL Server Extended Events is a feature that allows you to collect and monitor database events. You can use SQL Server Extended Events to create extended event sessions that collect lock events. You can then view the details of the collected lock events in the Extended Events Explorer.
Which tool should you use to monitor locks?
The best tool to use to monitor locks depends on your specific needs. If you are looking for a GUI tool, SSMS is a good option. If you need to trace lock events, SQL Server Profiler is a good option. If you need to collect and monitor lock events in real time, SQL Server Extended Events is a good option.
SQL Server Azure DB
How to use SSMS to monitor locks
To use SSMS to monitor locks, follow these steps:
You can view the details of each lock by clicking on it in the Locks pane. The details of the selected lock will be displayed in the Properties pane.
- Open SSMS.
- Connect to the SQL Server instance that you want to monitor.
- In the Object Explorer pane, expand the Databases node and then expand the database that you want to monitor.
- Expand the Locks node.
- The Locks pane will display a list of all current locks on the selected database.
You can view the details of each lock by clicking on it in the Locks pane. The details of the selected lock will be displayed in the Properties pane.
How to use SQL Server Profiler to monitor locks
To use SQL Server Profiler to monitor locks, follow these steps:
The trace will capture all lock events that occur on the selected SQL Server instance. To view the details of the captured lock events, open the trace file in SQL Server Profiler and expand the Events node.
- Open SQL Server Profiler.
- Connect to the SQL Server instance that you want to monitor.
- Create a new trace file.
- In the Trace Properties dialog box, select the Lock event category.
- Click Start to start the trace.
The trace will capture all lock events that occur on the selected SQL Server instance. To view the details of the captured lock events, open the trace file in SQL Server Profiler and expand the Events node.
How to use SQL Server Extended Events to monitor locks
To use SQL Server Extended Events to monitor locks, follow these steps:- Create an extended event session that collects lock events.
- Start the extended event session.
- View the details of the collected lock events in the Extended Events Explorer.
- Create an Extended Event Session to Collect Lock Events: https://learn.microsoft.com/en-us/sql/relational-databases/extended-events/sql-server-extended-events-sessions?view=sql-server-ver16
- View Extended Events Session Data: https://www.mssqltips.com/sqlservertutorial/9209/view-sql-server-extended-events-data/
Using SQL-EM to monitor locks
SQL-EM can monitor locks for either a process or for an object. To get to the Lock display, you must follow these steps while running SQL-EM:
- Select the server group
- Select the server
- Select Management
- Select Current Activity
- Select Lock/Process ID or Select Lock/Object
- Select the process or object to view lock details
View locks by object
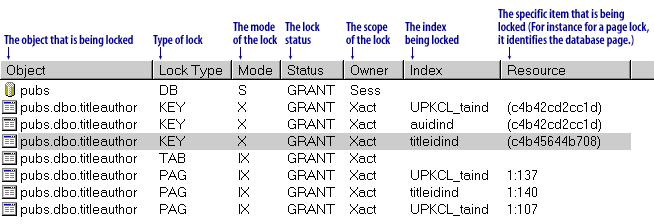
The diagram below describes the SQL EM Lock by Process to observe SQL-EM locks by object screen.
The same column headers will be seen in this display as you did when you viewed the locks by process screen.
In the screens you just viewed there are columns for lock mode and lock status.
Mode – A lock mode can be…
- Shared
- Update
- Exclusive
- Intent
- Schema
- Bulk update
…or a combination of these.
Status – A lock’s status can be…
- Grant: A granted lock
- Wait: Locks that have been requested
- CNVT – Locks that are being converted
When viewing locks with SQL-EM you can double-click the lock to see the SQL that caused the lock.
In SQL-EM there is no way to view detailed information on all of the current locks.
The next lesson covers how to monitor the overall performance of the SQL Server.
The next lesson covers how to monitor the overall performance of the SQL Server.