| Lesson 5 | Trace data columns |
| Objective | Identify the information that can be traced. |
Trace Data Columns in SQL-Server
When tracing events, you can specify the information that will be displayed as part of your trace and the information that will be written to the trace table and the trace file.SQL Server's trace flags used for Statistics on Data Columns
Here's a breakdown of what they were used for prior to SQL Server 2016:
Purpose of Trace Flags for Column Statistics
In versions of SQL Server before 2016, trace flags were used to modify how the query optimizer used statistics to create execution plans. This was important because:
Why This Matters Using the right trace flags (especially 2371) helped DBAs and developers ensure the query optimizer had more up-to-date information. This was critical for maintaining optimal performance in SQL Server databases prior to 2016.
Changes in SQL Server 2016 In SQL Server 2016, the behavior introduced by trace flag 2371 became the default setting. This meant that database administrators no longer had to manually enable this trace flag to get the benefits of more dynamic statistics update thresholds.
Purpose of Trace Flags for Column Statistics
In versions of SQL Server before 2016, trace flags were used to modify how the query optimizer used statistics to create execution plans. This was important because:
- Statistics Importance: SQL Server maintains statistics about the distribution of data within columns and tables. These statistics are vital for the query optimizer to choose efficient ways to retrieve and join data.
- Outdated Statistics: If statistics become outdated (due to lots of changes in the underlying data), the query optimizer might make poor execution plan choices, leading to slow queries.
- Trace Flag 2371: This trace flag was a key tool for influencing when SQL Server considered column statistics to be outdated and in need of an update. Before SQL Server 2016, the thresholds for determining stale statistics were relatively static. Trace flag 2371 introduced a more dynamic threshold that adjusted based on table size, allowing for more frequent updates of statistics on larger tables.
Why This Matters Using the right trace flags (especially 2371) helped DBAs and developers ensure the query optimizer had more up-to-date information. This was critical for maintaining optimal performance in SQL Server databases prior to 2016.
Changes in SQL Server 2016 In SQL Server 2016, the behavior introduced by trace flag 2371 became the default setting. This meant that database administrators no longer had to manually enable this trace flag to get the benefits of more dynamic statistics update thresholds.
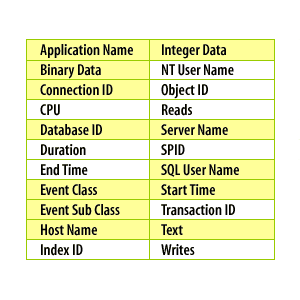
The following diagram below shows you the different data that can be tracked.
Each explanation is followed by the name of the database column in parentheses.
View the image below to see how this data is displayed.
View the image below to see how this data is displayed.
Trace Data Columns
- Application Name – The name of the application that generates the event.
- Binary Data – For some events this column will contain extra information in a binary format.
- Connection ID – A unique ID for each connection.
- CPU – The amount of CPU time (in milliseconds) that the event took.
- Database ID – The database name that the transaction was done in.
- Duration – How long the event took. Not all events will have a duration.
- End Time – When the event ended.
- Event Class – The class of event.
- Event Sub Class – The subclass of the event.
- Index ID – If an index was used, this is its Index ID.
- Integer Data – For some events this column will contain extra information in an integer format.
- NT User Name – The Windows NT user name of the client that generated the event.
- Object ID – The unique ID for the monitored object.
- Reads – The number of logical reads performed by SQL Server to execute the statement.
- Server Name – The name of the SQL Server used in the trace.
- SPID – Each connection has a unique SPID.
- SQL User Name – The standard security user who generates the event.
- Start Time – The time that the event started.
- Transaction ID – The identifier of the transaction that the event is a part of.
- Text – The statement that generated the event data.
- Writes – The number of disk writes performed by SQL Server to execute the statement.
Display of trace data
Scroll across to see all the other data columns. The information that you see on your screen will be the same information that is stored in the trace file and the trace table. While the trace table can be queried with SQL, the trace file is stored in a binary format.
In the next lesson, you will learn how to use the Index Tuning Wizard.
In the next lesson, you will learn how to use the Index Tuning Wizard.