| Lesson 3 | Monitoring connections with SQL-EM |
| Objective | Use SQL-EM to monitor Connections. |
Monitoring Connections with SQL-EM
Using SQL-EM to monitor Connections
In addition to the
The following Slide Show illustrates the SQL-EM process monitor screen.
Note that this screen is too large to show the entire thing on one page, so the SlideShow simulates scrolling across the screen from left to right.
sp_who procedure, the SQL-EM process monitor can
also be used to monitor connections. It displays a much more detailed level of information than the sp_who stored procedure does. To get to the Process Info display, you must follow these steps from inside SQL-EM:
- Select the server group
- Select the server
- Select Management
- Select Current Activity
- Select Process Info
The following Slide Show illustrates the SQL-EM process monitor screen.
Note that this screen is too large to show the entire thing on one page, so the SlideShow simulates scrolling across the screen from left to right.
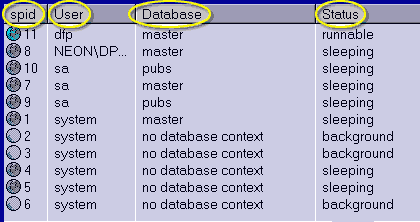
- Spid: The system process identifier,
- User: The user that is connected,
- Database: the database that the user is in,
- Status: The status of the process
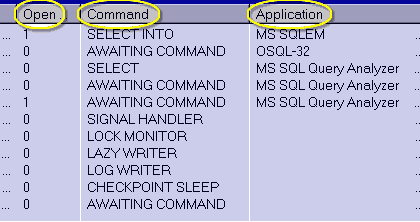
- Open Transaction: The number of nested transactions that the connection has open,
- Command: A high level representation of the last command that ran,
- Application: The name of the application that is connecting to SQL Server (This column only has a value if the application sets it).
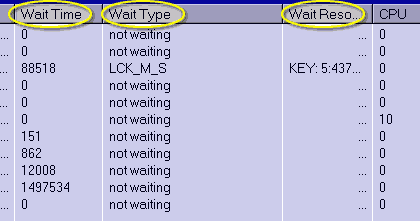
- Wait Time: The length of time the connection has been waiting (if the connection is not waiting this is a zero.)
- Wait Type: identifies what type of resource the process was waiting for (Some of the common classes of waits are locks, latches, or SQL Server internal resources.)
- Wait Resource: Identifies the resource that the connection is waiting for,
- CPU: Cumulative CPU time for the process of all statements executed with the set statistics time option turned on
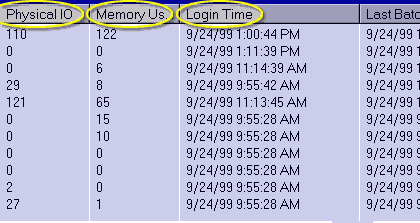
- Physical IO: The total number of reads and writes performed by the process,
- Memory Usage: The number of procedure cache pages allocated to this process (If the number is negative, the process is freeing pages belonging to another process.)
- Login Time: The date and time that the connection was made.
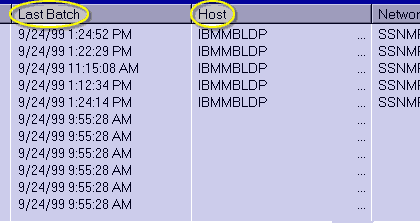
- Last Batch - the date and time that the connection performed an RPC or an execute statement,
- Host: The name of the computer that the client is connecting from
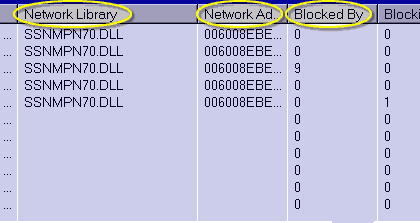
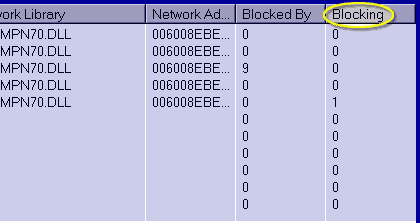
- Network Library: Identifies the netlib dll used to connect to the server ,
- Network Address: Identifies the client's network interface card,
- Blocked By : The SPID of the process that is blocking the current process.
Monitoring with SQL Server - Enterprise Manager
Use SQL Server Enterprise Manager to view the following information about current Microsoft SQL Server activity:
If you are a system administrator, you can view additional information about a selected process, send a message to a user who is connected currently to an instance of SQL Server, or terminate a selected process. Use the current activity window in SQL Server Enterprise Manager to perform ad hoc monitoring of an instance of SQL Server. This allows you to determine, at a glance, the volume and general types of activity on the system, for example:
- Current user connections and locks.
- Process number, status, locks, and commands that active users are running.
- Objects that are locked, and the kinds of locks that are present.
If you are a system administrator, you can view additional information about a selected process, send a message to a user who is connected currently to an instance of SQL Server, or terminate a selected process. Use the current activity window in SQL Server Enterprise Manager to perform ad hoc monitoring of an instance of SQL Server. This allows you to determine, at a glance, the volume and general types of activity on the system, for example:
- Current blocked and blocking transactions.
- Currently connected users on an instance of SQL Server and the last statement executed.
- Locks that are in effect.
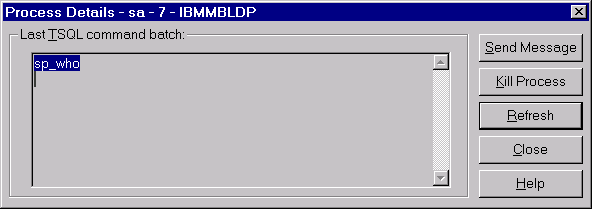
When monitoring processes with SQL-EM, you can double-click a process and see the last command that the process executed.
Click the View Image button to see an example. If you hit the Kill button it will terminate the process. You can also terminate processes with the Kill command. The next lesson covers how to view locked resources.
sp_who Quiz
Click the Quiz link below to test your knowledge of the concepts presented in this module so far.
sp_who quiz
sp_who quiz