Extended Events vs. Running Traces in SQL-Server (post 2016)
Extended Events in SQL Server (post-2016) serves as the more advanced replacement for the deprecated SQL Server Profiler and its concept of traces. Here's how it compares and what makes Extended Events even better:
Extended Events vs. Traces
Core Concept: Both Extended Events and SQL Server Profiler are designed to capture and monitor events occurring within your SQL Server instance. These events can be things like query executions, stored procedure calls, logins, errors, and more.
Key Advantages of Extended Events:
Lower Performance Overhead: Extended Events are far more lightweight, integrated into the SQL Server engine itself. This minimizes their impact on your server's performance, unlike SQL Trace, which could introduce noticeable slowdown.
More Granular Control: You have finer control over the events you capture, allowing you to target very specific actions and reduce the amount of collected data.
Greater Flexibility: Extended Events offers a wider range of events to monitor and more powerful filtering options.
Better Integration: Extended Events data can be analyzed directly in SSMS or consumed by other tools.
How to Achieve 'Running Traces' with Extended Events
Create an Extended Events Session: In SSMS, expand the 'Management' folder -> 'Extended Events' -> Right-click 'Sessions' -> 'New Session'.
Select Events: Choose the specific events you want to capture (e.g., rpc_completed, sql_batch_completed, error_reported).
Apply Filters (Optional): Add filters to further narrow down the captured events, such as filtering by database, user, or specific criteria within the event data.
Choose a Target: Select where to store the captured data, such as:
event_file: A file on disk for further analysis.
ring_buffer: In-memory storage for recent events.
Start the Session: Once configured, start your Extended Events session and it will begin capturing data based on your settings.
Monitoring Live Data
The "Live Data" viewer in SSMS allows you to observe event data from the session in real-time, as it is being captured.
Analyzing Historical Data
You can open the saved .xel file (if using the event_file target) using SSMS to analyze the collected event data.
Key Points
Extended Events does away with the 'trace' terminology, but the concept of monitoring events and processes is analogous.
You'll find far greater control and efficiency with Extended Events compared to the legacy SQL Server Profiler.
Create, Run a Trace
After you create a trace, the trace will run automatically. You will see the output on your screen and, depending upon
what you specified in the trace definition, the output can go to either a file or a table.
Trace Order
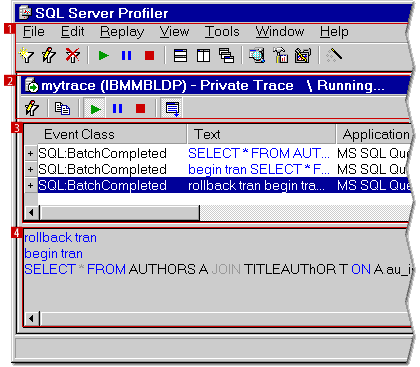
The following diagram shows you what SQL Server Profiler will look like when a trace is running:
Running SQL Server Profiler
Running SQL Profiler
Top menu bar and icons under it – You can create, run , stop, modify, or replay traces from the main menu.
Second set of icons – Allows you to control the active trace.
Area with the white background – Displays the data columns for the events that match your filter.
Area with the gray background – Displays the full SQL Statement that generated the trace.
Three ways to run a trace
To run a trace you have three options:
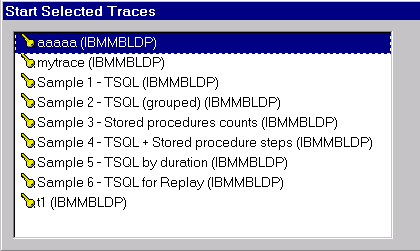
Select File->Run Traces.
Select the Start Traces icon from the top set of icons.
Select the Start This Trace icon from the set of icons for the active trace.
SQL Server Profiler uses the same icon for starting the active trace as for starting an inactive trace. If you select
Run Traces or the Start Traces icon you will get the Start Selected Traces screen that will display all the defined
traces.
This is the caption for Layout Figure Tag
Pause a Running Trace
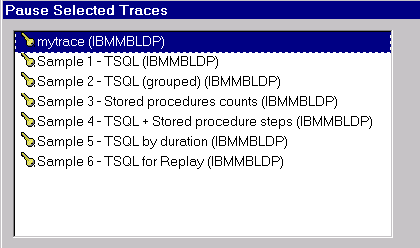
You can pause any running trace. Again, you have three ways of doing this:
Select File->Pause Traces.
Select the Pause Traces icon from the top set of icons.
Select the Pause This Trace icon from the set of icons for the active trace.
SQL Server Profiler uses the same icon for pausing the active trace as for pausing inactive traces. If you select Pause
Traces or the Pause Traces icon you will get the Pause Selected Traces screen that will display all the running and
paused traces.
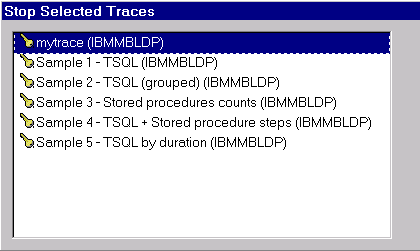
Stop a running trace
You can stop any trace that is running or paused. You have three ways of doing this:
Select File->Stop Traces.
Select the Stop Traces icon from the top set of icons.
Select the Stop This Trace icon from the set of icons for the active trace.
Stop a running trace
Like the Start and Pause icons, SQL Server Profiler uses the same icon for pausing the trace in the selected windows as
for pausing all traces.
If you select Stop Traces or the Stop Traces icon you will get the Stop Selected Traces screen that will display all
the running and paused traces. Stop selected Traces
If a trace has been paused and then started again, the trace will continue leaving the current trace information in the Trace Output window.
If you stop and restart a trace, the Trace window will be cleared.
The next lesson will show you how to replay a trace.