| Lesson 2 | The Entity-Relationship (ER) Diagram |
| Objective | Explain the role and function of an ER diagram in data modeling. |
Purpose of ER Diagrams in Data Modeling
An Entity-Relationship Diagram (ERD) is a core tool in data modeling. It provides a visual representation of entities, attributes, and relationships, and it plays a central role in designing and understanding relational databases. ERDs are used not only in initial design, but also as documentation, communication aids, and integration tools.
- Data Structure Visualization: ERDs illustrate how entities connect, along with their attributes and constraints. By presenting the database structure graphically, they make complex systems easier to interpret.
- Database Design: ERDs serve as blueprints. They capture business rules, constraints, and relationships that are translated into relational schemas and implemented in SQL-based databases.
- Documentation: As living documents, ERDs provide reference material for DBAs, developers, and business stakeholders throughout the database life cycle. They help new team members quickly grasp the data model.
- Improving Communication: ERDs bridge the gap between technical and non-technical audiences. By presenting data visually, they allow system analysts, designers, and end-users to share a common understanding of the system.
- System Analysis and Enhancement: ERDs can reveal redundancies, inefficiencies, or missing relationships in existing databases, making them useful for continuous improvement.
- Data Integration: When merging data from multiple systems, ERDs offer a holistic view of structures and help define mappings across sources.
ERD Objectives
An ER diagram is a conceptual model that captures business rules in a concise, structured format. Its objectives include:
- Providing a unified view of entities, attributes, and relationships within a system.
- Acting as a communication tool for validating business rules during design.
- Serving as a blueprint for generating a relational database, typically using SQL[1].
- Maintaining documentation throughout the database life cycle, supporting future structural changes.
Most modern CASE tools support ERDs in similar ways. Regardless of the style or notation, the core function remains the same: visualize and enforce consistency in data modeling.
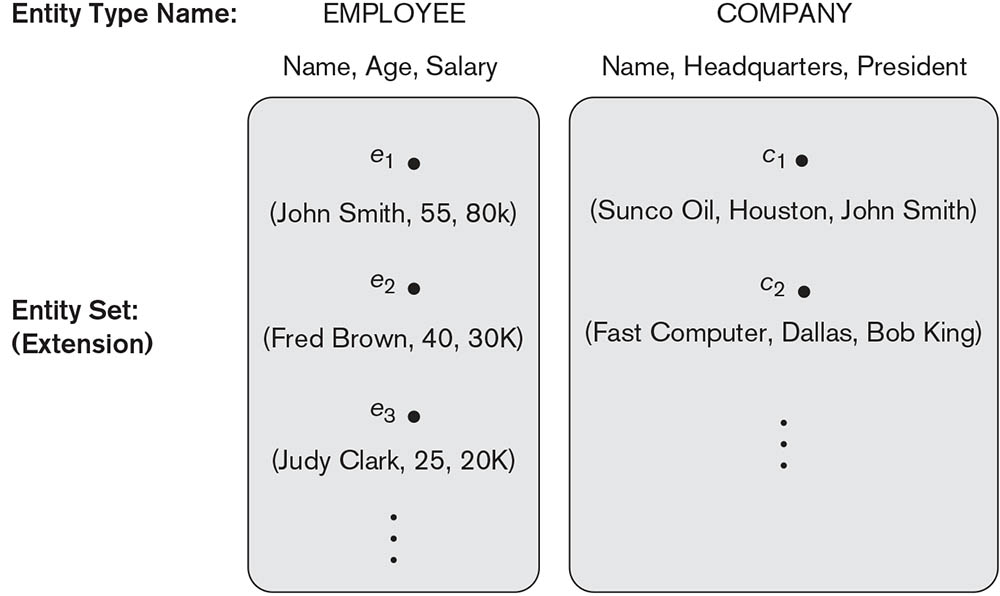
Value Sets (Domains) of Attributes
Each simple attribute in an entity type is associated with a value set (or domain), which specifies the permissible values. For example, in Figure 7-2, the Age attribute of EMPLOYEE might be restricted to integers between 16 and 70, while Name values may be alphabetic strings separated by spaces.
Value sets are usually expressed using standard programming language types (integer, string, Boolean, float, enumerated types, subranges) or database-specific types such as date and time. While not shown on ER diagrams, they are vital in defining the validity of data.
Attributes Defined Using Power Sets
Mathematically, an attribute A of entity set E with value set V can be represented as a function from E to the power set [2] of V:
A : E → P(V)
For an entity e, the value of A(e) can represent single-valued or multivalued attributes, including NULLs (the empty set). For composite attributes [3], the value set is defined as a power set of the Cartesian product of its component attributes:
V = P(P(V1) × P(V2) × ... × P(Vn))
Although these sets describe the full potential range of attribute values, the actual database will only hold values that correspond to the current state of the modeled domain (the "miniworld").
The next lesson introduces three well-known examples of ER diagram applications.