| Lesson 9 | Entity–Relationship Diagrams — Conclusion |
| Objective | Consolidate ERD concepts and reinforce how to read any notation consistently. |
Entity-Relationship Diagrams: What You Should Now Be Able to Do
Across this module you learned to read and create ERDs regardless of notation—Crow’s Foot, Chen, or IDEF1X. You practiced diagramming entities and attributes, encoding relationship types (1:1, 1:N, M:N), expressing participation (mandatory vs optional), and verbalizing rules in plain language. You also reviewed your model with end users and captured revisions. Together, these skills produced the Stories on CD ERD.
How to Read Any ERD in 60 Seconds
- Identify entities and keys: What objects are modeled? How is each uniquely identified (natural or surrogate keys)?
- Scan relationships both directions: State minimums (must/may) and maximums (one/many) at each end.
- Spot M:N and the junctions: Ensure many-to-many relationships are resolved with an associative entity and composite/alternate key.
- Check domains and constraints: Required attributes, value sets, and state-dependent rules (e.g., “Shipped implies Paid = true”).
- Verbalize a few rules: If you can say them clearly, you probably modeled them correctly.
Example ERD
ERDs visualize tables (entities) and the relationships between them. The example below (Figure 7-9) comes from a published-books domain and illustrates common patterns you’ve used throughout the module.
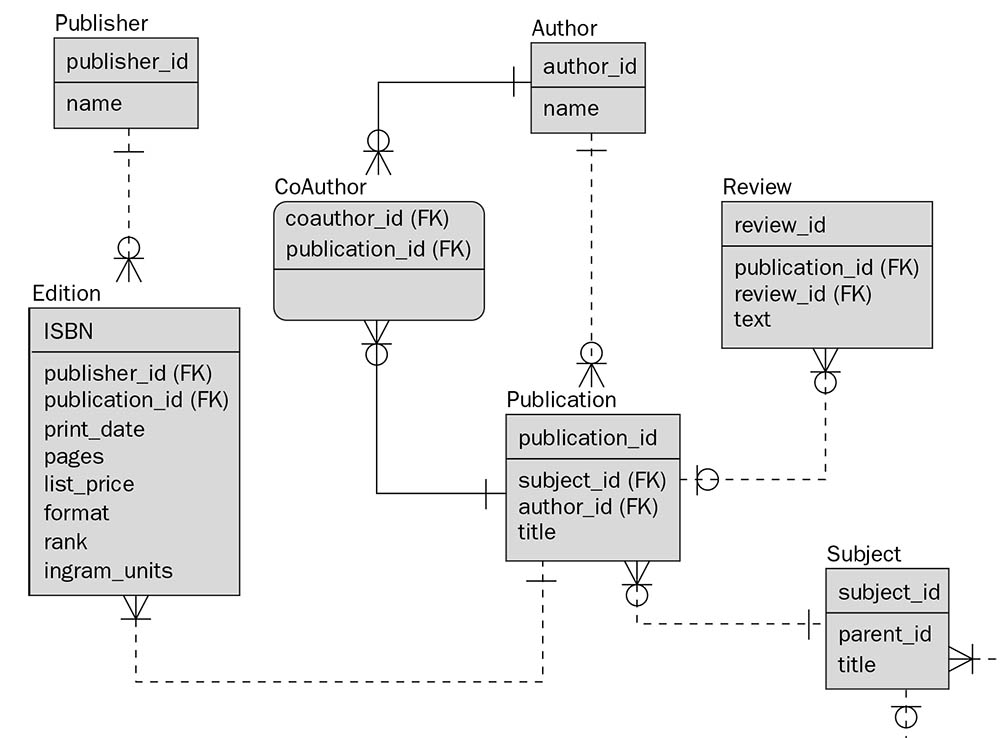
- PUBLISHER → BOOK: a 1:N relationship—each book has exactly one publisher; a publisher may have zero or many books.
- BOOK ↔ AUTHOR: a logical M:N relationship—implemented via an associative entity (e.g., BOOK_AUTHOR) that carries the two FKs and optional attributes like author order or role.
- Other entities (e.g., EDITION, GENRE) often appear as additional 1:N or M:N structures following the same rules.
Learning Objectives (Recap)
- Define the function of an ER diagram and why it’s central to data modeling.
- Describe the major ER notations (Crow’s Foot, Chen, IDEF1X) and translate between them.
- Diagram entities and attributes consistently; choose and label keys.
- Diagram 1:1, 1:N, and M:N (resolved with a junction) with clear participation.
- Capture optional vs mandatory participation and read relationships both directions.
- Revise an ERD after end-user review; track decisions and rationale.
- Verbalize an ERD using concise, testable sentences.
Glossary
- ER Diagram (ERD): A visual model of entities (tables) and the relationships between them.
- Crow’s Foot (Information Engineering): ER notation using line-end symbols to show cardinality and participation.
- Chen Notation: ER notation with entities (rectangles), relationships (diamonds), and attributes (ovals).
- IDEF1X: Standards-oriented ER notation emphasizing identifying vs non-identifying relationships and key migration.
- Cardinality / Participation: Maximum (one/many) and minimum (must/may) constraints on relationships.
- Associative Entity: A table that resolves M:N into two 1:N relationships and can hold attributes of the association.
- SQL: Structured Query Language used to define, query, and update relational data.
The next module wraps up the course and connects ERD deliverables to normalization and physical design.