| Lesson 7 | Data Flow Diagram |
| Objective | Explain the purpose of the data flow diagram. |
Data Flow Diagrams (DFDs)
During Requirements Analysis, interviews and database examinations reveal what data the organization needs to store. But they do not automatically reveal how that data moves through the organization — where it originates, which processes transform it, where it is held temporarily, and where it comes to rest. A data flow diagram (DFD) is the tool that makes those movements visible.
A DFD visualizes the flow of data through a business process or system without prescribing how that system will be implemented. It answers the questions that interviews sometimes leave open: who hands data to whom, which processes consume and produce data, and where data is stored between process steps. For a database designer, a DFD is not just a documentation artifact — it is a requirements discovery tool. Every data store identified in a DFD is a candidate database table. Every data flow crossing an organizational boundary is a candidate foreign key relationship. Every process is a transaction type that the database must support.
What a DFD Shows and Does Not Show
Understanding what a DFD includes and deliberately excludes helps designers use it correctly and avoid the common mistake of treating it as a system design document rather than a requirements analysis tool.
A DFD shows four things: external actors who send or receive data, processes that transform data, data stores where data rests between process steps, and data flows — the arrows that connect actors, processes, and stores and show the direction of data movement. Everything in a DFD describes data in motion or at rest. Nothing in a DFD describes how a system is built, what the user interface looks like, or when processes run relative to each other.
A DFD does not show timing, sequencing, or concurrency of processes. It does not show implementation details such as programming languages, hardware, or network topology. It does not show user interfaces. If a designer finds themselves drawing screens or databases into a DFD, they have crossed from requirements analysis into system design — a different stage of the DBLC.
Common DFD Notations
Two notation styles are in widespread use, and both convey the same four concepts using slightly different visual shapes. The choice between them is largely a matter of organizational convention or tooling preference.
The Yourdon/DeMarco notation uses squares for external entities, circles for processes, parallel horizontal lines for data stores, and arrows for data flows. This is the older of the two styles and remains common in academic and training contexts.
The Gane & Sarson notation uses squares for external entities, round-cornered rectangles for processes, and open-ended rectangles for data stores, again with arrows for data flows. CASE tools that support DFD generation typically support both styles. The important principle is to choose one notation and apply it consistently throughout all levels of a DFD set for a given project.
Reading a DFD — The Four Symbol Types
In the Yourdon/DeMarco notation, the four symbols each answer a specific question about the data:
- Squares — external entities. These are the people or systems that interact with the process being modeled. They exist outside the boundary of the system being designed. A customer who places an order is an external entity. A shipping carrier that receives a manifest is an external entity.
- Arrows — data flows. These show the movement of data between external entities, processes, and data stores. The direction of the arrow indicates which way data moves. An arrow labeled "Order Details" from a Customer square to an Order Entry circle means the customer sends order details to the order entry process.
- Circles — processes. These represent transformations performed on data. A process takes data in, does something to it, and produces data out. "Validate Order," "Calculate Discount," and "Update Inventory" are processes. Processes are always named with an active verb phrase.
- Parallel lines — data stores. These represent places where data rests between process steps. In a relational database context, each data store in a DFD typically corresponds to a database table. "Customer Records," "Order Log," and "Product Inventory" are data stores.
The AI-Driven Supply Chain as a Modern DFD Example
The diagram below illustrates how the four DFD concepts — external actors, processes, data stores, and flows — appear in a contemporary AI-orchestrated supply chain system. The terminology is different from a hand-drawn classroom DFD, but the underlying structure is identical.

Mapping the six numbered flows to classical DFD components clarifies the structure. Flows 1 and 2 represent external actors — the authenticated user with their personal data stream and the algorithmic supervision system — feeding data into the Smart Order Orchestrator, which is the central process node. Flow 3 shows the orchestrator committing smart contract state and product data to the Integrated Supply Chain Knowledge Graph, which is the primary data store — equivalent to a parallel-line data store in Yourdon/DeMarco notation. Flow 4 shows the authorization and route configuration process feeding the dispatch system. Flows 5 and 6 show the Autonomous Logistics Pathway feeding real-time tracking and delivery verification back into the knowledge graph data store, closing the loop.
The external actors in this system — the User Persona Profile on the left and the Supply Chain Operative on the right — are the squares in classical DFD notation. The Smart Order Orchestrator and the Autonomous Logistics Pathway are the circles. The Integrated Supply Chain Knowledge Graph and the blockchain transaction log are the parallel-line data stores. The numbered arrows connecting them are the data flows. The vocabulary has been modernized — smart contracts, biometric authentication, quantum tracking — but the four-component structure that Yourdon and DeMarco defined decades ago is unchanged.
This is the key insight that DFD notation provides: the same four questions — who handles data, how does it move, what transforms it, where does it rest — apply equally to a 2026 AI logistics ecosystem and to a small family business selling children's audio CDs by mail.
Applying DFD Thinking to Stories on CD, Inc.
For Stories on CD, Inc., a DFD of the mail-order process makes the database requirements concrete in a way that the interview transcripts alone do not. Tracing the mail-order workflow through the four DFD components produces the following picture.
The Customer is the external entity — represented as a square — who initiates the flow by submitting an order. The order details flow from the Customer square into the Order Entry process circle, where a staff member records the order in the system. The Order Entry process writes the order record to the Order data store — a parallel-line store that corresponds directly to the Order table in the relational database. The Order data store feeds the Fulfillment process circle, where a staff member picks the relevant CDs, packages them, and prepares the shipment. The Fulfillment process writes a shipping record to the Shipping Status data store and generates a shipping notification that flows back to the Customer external entity as an outbound data flow.
That DFD, drawn on a whiteboard in five minutes during a stakeholder interview, immediately answers several requirements questions. The Order data store and the Shipping Status data store are table candidates — they appear as persistent storage in the process flow and will need to be represented in the relational database. The flow from Order Entry to the Order data store identifies the attributes that the Order Entry process must capture: enough information to create a complete order record. The outbound flow to the Customer identifies that the system needs to support some form of customer notification — an email address attribute on the Customer table, or a separate notification log table. None of these requirements were stated explicitly in the interviews, but they become visible the moment the data flow is drawn.
DFD vs. Data Model — A Critical Distinction
The DFD and the data model serve different purposes and should never be conflated. The DFD has a flow focus: it describes who uses and handles data, how data moves between actors and processes, and which processes transform it. The data model has a structure focus: it describes entities, their attributes, and the relationships between them as they will be stored in the database.
The practical consequence of this distinction is important for scoping. If a person or system appears in a DFD as an external entity but the organization does not need to store data about that actor, the actor will not appear as an entity in the ER diagram. For Stories on CD, Inc., the shipping carrier appears in the mail-order DFD as the external entity that receives the shipment manifest and returns a tracking confirmation. But the Martins do not need to store data about the carrier in their database — carrier selection is handled externally. So the shipping carrier is a square in the DFD but does not become a table in the database.
This distinction helps the designer make deliberate scoping decisions rather than accidentally including entities in the ER diagram that do not belong to the subject database, or missing entities that the DFD implicitly requires.
Top-Level DFDs and Decomposition
For any system beyond the simplest, a single DFD cannot show both the big picture and the operational detail at the same time. The standard approach is to begin with a top-level or context DFD that shows the system as a single process surrounded by its external entities and the data flows between them. This top-level view establishes the boundary of the system — what is inside and what is outside. It is sometimes called a Level-0 DFD or context diagram.
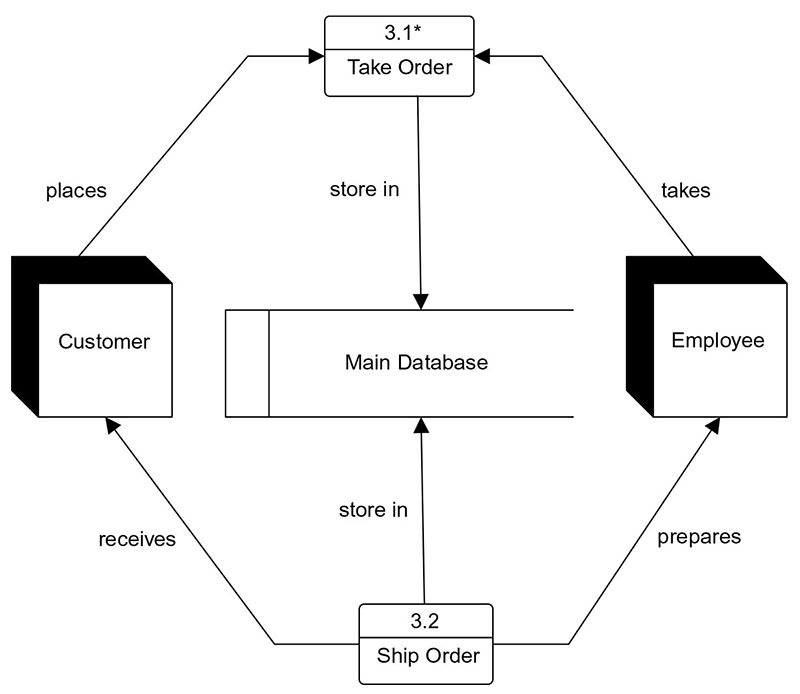
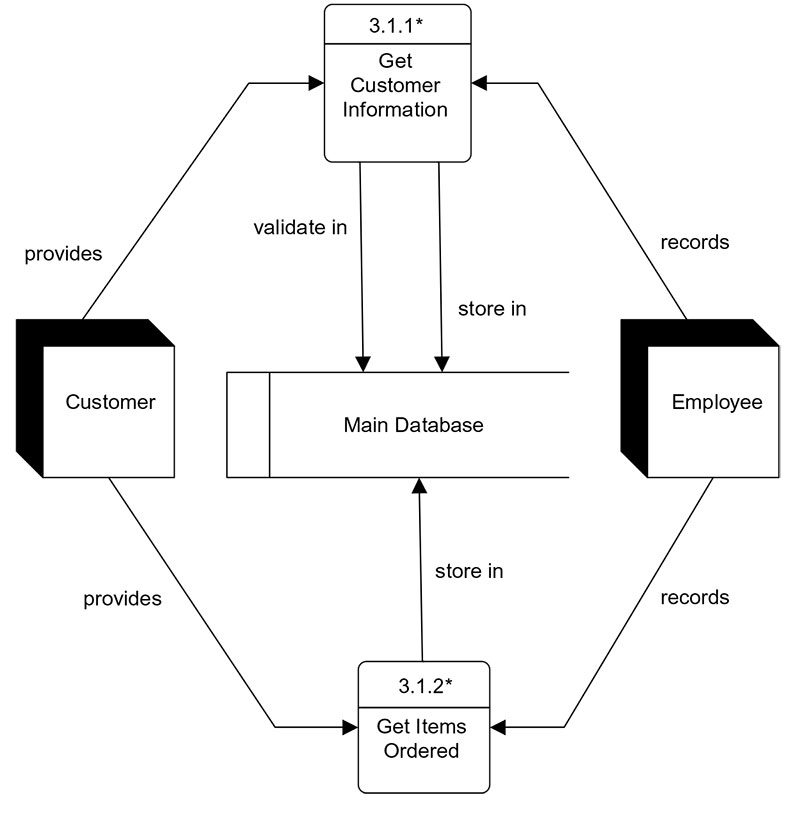
Once the top-level DFD is agreed upon with stakeholders, the designer explodes each major process into a Level-1 DFD that shows the sub-processes within it. The "Take Order" process in the top-level DFD, for example, might explode into three sub-processes at Level-1: Gather Customer Information, Gather Item Information, and Confirm Order. Each of these can be further exploded into Level-2 DFDs if the detail is needed. The decomposition continues until each process at the lowest level is simple enough to describe in a few sentences — the point at which it can be directly translated into a database transaction or application function.
For Stories on CD, Inc., the top-level DFD shows two main processes: Order Processing (covering both in-store and mail-order channels) and Marketing (covering brochure production and mailing list management). Each of these can be exploded to reveal the sub-processes and data stores that the database must support. The Order Processing explosion reveals the Order Entry, Fulfillment, and Shipping Status sub-processes already identified in the mail-order DFD. The Marketing explosion reveals the Customer List Segmentation sub-process that Jane Martin described during her interview — the process of selecting which customers receive each brochure edition based on customer type and purchase history.
What the DFD Reveals for Requirements Analysis
A completed DFD set contributes three specific types of information to the requirements specification that cannot be reliably obtained any other way.
First, every data store in the DFD is a table candidate. If the DFD shows an Order data store and a Shipping Status data store, the requirements specification should include an Order table and a Shipping Status table — or a combined table if the analysis supports that consolidation. Data stores that appear in the DFD but are not captured in the requirements specification will result in missing tables in the final database.
Second, every data flow that crosses an organizational boundary is a foreign key candidate. When data flows from the Order Entry process to the Fulfillment process carrying an Order ID, that Order ID must appear in both the Order table and the Fulfillment or Shipping table as a linking field. The DFD makes these cross-boundary flows explicit and traceable.
Third, every process in the DFD is a transaction type the database must support. The Order Entry process requires an INSERT transaction on the Order table. The Fulfillment process requires a SELECT on Order and an UPDATE on Shipping Status. The Customer List Segmentation process requires a SELECT on Customer with filtering by customer type and purchase history. Mapping DFD processes to database transactions during Requirements Analysis ensures that the logical design includes the indexes and query structures needed to support the application's performance requirements.
When a DFD Is Needed
For small, single-subject systems with straightforward processes, a DFD is often optional. If the interviews and database examination have produced a clear picture of the business objects, their characteristics, and their relationships, and if the user views required are simple and well-understood, the designer may be able to proceed directly to the ER diagram without drawing a DFD.
For larger systems, multi-database environments, or systems with complex handoffs between departments or external parties, a DFD is recommended. The more complex the data movement, the more valuable the DFD becomes as a tool for identifying requirements that interviews alone would miss. For Stories on CD, Inc., the dual-channel sales model — in-store and mail-order — creates enough complexity in the order processing flow to make a DFD worthwhile. The distinction between the two channels affects which data is captured at order entry, which fulfillment steps apply, and which shipping status fields are relevant.
The next lesson covers user views — the mechanism by which different categories of users interact with a subset of the database data relevant to their specific role.
Data Flow - Exercise
Data Flow - Exercise