| Lesson 9 | Query Store in SQL Server |
| Objective | Shift from "Trace Wizard" to Query Store |
Shift from Trace Wizard to Query Store
In older SQL Server releases, administrators frequently relied on SQL Server Profiler and the Trace Wizard to “catch” performance problems by manually running a trace, saving the output, and then analyzing it after the fact. Microsoft’s modern approach is different: Query Store is an always-on, database-scoped flight recorder that continuously captures query text, execution plans, and runtime statistics so you can diagnose regressions using real production history instead of one-off trace files.
Why the Trace Wizard is considered legacy
SQL Trace and SQL Server Profiler are deprecated and will be removed in a future SQL Server version. For new monitoring workflows, you should plan on using Query Store (for query performance history and regressions) and Extended Events (for event-style diagnostics such as deadlocks, waits, and error events).
Concept mapping: Trace Wizard tabs vs. modern tooling
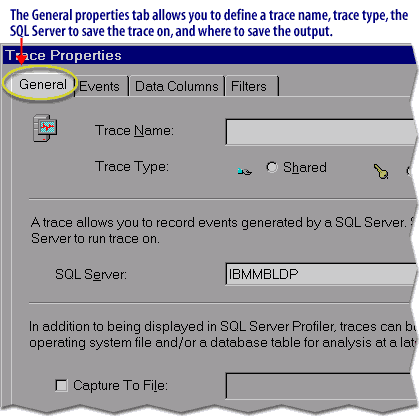
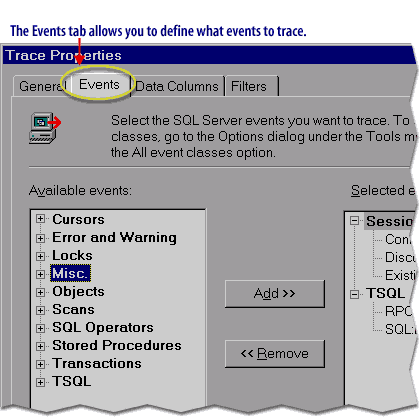
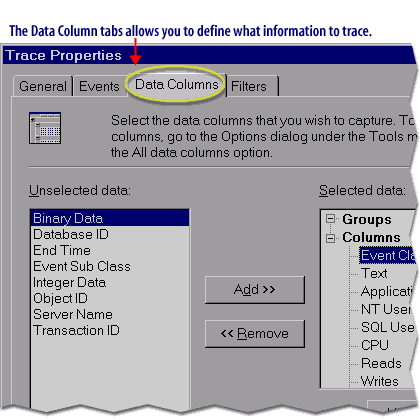
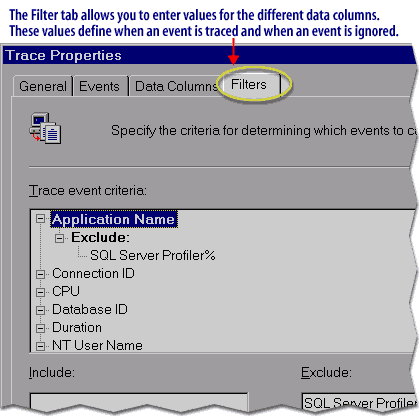
The Trace Wizard UI (shown in the legacy screenshots below) is still useful as a conceptual model because the same “pipeline” exists today—just with different technologies and a different philosophy.
| Legacy concept (Trace Wizard / Profiler) | Modern equivalent | Where it belongs now |
|---|---|---|
| Define a trace name and output destination | Enable/configure Query Store storage + retention | Query Store (database scoped) |
| Select events to trace | Choose query/performance reports and time windows | Query Store (workload history) |
| Select data columns | Choose metrics (CPU, duration, reads, writes) and plan details | Query Store (plans + runtime stats) |
| Filter events/columns | Filter by time interval, query_id, plan_id, execution count, or resource threshold | Query Store reports + catalog queries |
| Trace for deadlocks/logins/errors | Event-based capture with low overhead | Extended Events sessions |
Enable and configure Query Store (T-SQL baseline)
Query Store is configured per database. The operational goal is to keep it in READ_WRITE mode, set a reasonable max size, and use automatic cleanup so it does not drift into read-only mode due to storage pressure.
ALTER DATABASE [YourDatabaseName]
SET QUERY_STORE = ON
(
    OPERATION_MODE = READ_WRITE,
    QUERY_CAPTURE_MODE = AUTO,
    MAX_STORAGE_SIZE_MB = 1024,
    CLEANUP_POLICY = (STALE_QUERY_THRESHOLD_DAYS = 30),
    SIZE_BASED_CLEANUP_MODE = AUTO,
    DATA_FLUSH_INTERVAL_SECONDS = 900,
    INTERVAL_LENGTH_MINUTES = 60
);
Operational workflow: replacing “run a trace” with Query Store analysis
- Confirm Query Store is collecting. Ensure the database is in READ_WRITE mode and not size-constrained. If it is read-only, increase max size and/or reduce retention (stale threshold).
- Use built-in dashboards for fast triage. In SSMS, Query Store provides reports such as: Top Resource Consuming Queries, Regressed Queries, and queries with high CPU/duration/reads.
- Perform regression analysis by comparing time windows. Identify when performance changed (for example, “last 24 hours” vs. “previous week”), then drill into the query_id and plan_id to see whether a plan change correlates with the regression.
- Stabilize quickly with Plan Forcing. If the regression is plan-related, force the last known good plan (and continue monitoring).
- If plan forcing is not appropriate, use Query Store Hints. Apply a targeted hint (such as RECOMPILE or MAXDOP) without changing application code.
Example: apply a Query Store hint without changing application code
Query Store hints allow DBAs to influence plan shape for a specific query_id using an OPTION() hint string. This is particularly useful when you need a controlled mitigation (for example, limiting parallelism or forcing recompilation) while you work on a longer-term fix.
-- Example: attach a hint to a known query_id (replace 12345 with your query_id)
EXEC sys.sp_query_store_set_hints
     @query_id = 12345,
     @query_hints = N'OPTION (RECOMPILE)';
When Query Store is not the right tool
Query Store is designed for query/performance history, regressions, and plan-level tuning. If your requirement is event-style diagnostics (deadlocks, lock escalations, error events, waits, or capturing specific engine activities), the modern replacement for Trace Wizard behavior is Extended Events (XE), not Query Store.
Legacy Trace Wizard screenshots (historical reference)
The screenshots below document how the Trace Wizard worked. Use them as a reference for the legacy workflow, but treat the UI as historical. The modern workflow is: Query Store for regressions and top resource queries, Extended Events for event capture.
Query Store - Quiz
Query Store - Quiz
The next lesson will review what was presented in this module.