| Lesson 4 | Events |
| Objective | Identify the events that Extended events in SQL Server can track. |
Extended Events: Event Types You Can Track in SQL Server
Extended Events (XE / XEvents) is SQL Server’s primary instrumentation framework for performance monitoring and troubleshooting. If you have legacy experience with SQL Trace / Profiler, the mental model carries forward, but the implementation is modern: you define an event session, choose events to capture, optionally add actions (extra context), apply predicates (filters), and write results to a target (most often an event_file that creates .xel files).
The most important skill is not memorizing thousands of possible events. Instead, you want to recognize the major areas of server behavior that XE can track, and know a handful of “go-to” events for each area (query execution, errors, locks, deadlocks, waits, logins, and so on).

Common Event Areas Extended Events Can Monitor
The table below replaces the legacy “Profiler event classes” concept with a practical XE view: the problem domain, the events you typically capture, and what you look for during analysis.
| Event area | Examples of what XE can capture | When to track | Analysis focus |
|---|---|---|---|
| Query execution (batches, RPC, statements) | Batch completion / RPC completion / statement completion, duration, CPU, logical reads, writes, row count, query hash / plan hash (when available) | Slow queries, regressions, ad hoc spikes, parameter sensitivity investigations | Identify “top” offenders by duration/CPU/reads; correlate to login/app/database; validate plan changes with query/plan hash context. |
| Stored procedure internals | Stored procedure statement completion events, nested statement execution, module/object context (when collected) | Stored procedure runs slowly, but the “outer” call is not enough to isolate the bottleneck | Find the expensive statement inside the procedure; correlate inner statements to the caller; confirm repeated recompiles or excessive reads. |
| Errors and warnings | Error reported events (severity/state/message), attention/cancel events, timeouts, failed logins (where applicable) | Application errors, intermittent failures, noisy warning storms, unexpected cancellations | Count and group by error number and database/user/app; determine whether errors correlate with blocking, memory pressure, or timeouts. |
| Locks and blocking | Lock acquisition/release patterns (captured selectively), blocked process reports (when configured), lock escalation signals (scenario-dependent) | Sessions “hang,” throughput drops, users report freezes, or blocking chains appear | Identify lead blocker and victims; correlate blocking to object, query text, transaction scope, and duration; evaluate indexing and isolation strategy. |
| Deadlocks | Deadlock events (including XML graphs where supported), deadlock chains (scenario-dependent) | Recurring deadlocks, sporadic application failures with deadlock victim errors | Use the deadlock graph to identify resources and order; fix via indexing, consistent access order, shorter transactions, or isolation adjustments. |
| Waits and scheduler pressure | Wait information events (sampled/filtered), CPU scheduling signals, worker thread pressure indicators (scenario-dependent) | System-wide slowness where query-level tracing alone doesn’t explain symptoms | Determine dominant wait categories; correlate to IO, CPU, locking, memory grants, or external dependencies. |
| Memory and tempdb symptoms | Memory grant signals (scenario-dependent), spills/sorts warnings (scenario-dependent), tempdb contention indicators (scenario-dependent) | Hash/sort spills, large tempdb growth, sudden performance cliffs during big queries | Identify statements with spills or large grants; correlate to plan shape and statistics; tune indexing, cardinality, and tempdb configuration. |
| Logins and session lifecycle | Login/logout activity, session disconnect storms, authentication failures (scenario-dependent) | Connection churn, pool misconfiguration, authentication issues, “too many connections” symptoms | Measure connect/disconnect rates; correlate to application name/host; validate pooling and retry behavior. |
| Database changes and DDL activity | Object create/alter/drop patterns (scenario-dependent), schema changes, configuration changes (scenario-dependent) | Unexpected changes, deployments, permission drift, or diagnosing sudden plan/perf changes after releases | Attribute change activity to principal/app/host; correlate to deployment windows; confirm expected vs. unexpected modifications. |
Note: “scenario-dependent” indicates availability and event naming can vary by SQL Server version/edition and workload context. In practice, you select a small set of events that match the question you’re answering, then filter aggressively.
Event Ordering in Extended Events
In legacy Profiler/Trace workflows, ordering often relied on a global sequencing model. Extended Events is designed for throughput and concurrency: it can dispatch events asynchronously, so event output may not appear in strict firing order at the target.
Two practical ways to restore reliable order during analysis
- Add an event sequence action: include package0.event_sequence so you can sort captured rows into session-local sequence order. This is the closest “drop-in” replacement for the old Profiler ordering mindset.
- Enable causality tracking: use TRACK_CAUSALITY = ON so related events can be correlated across connections/tasks. This is the modern approach when you need to follow a logical flow through complex activity.
CREATE EVENT SESSION [OrderExample] ON SERVER
ADD EVENT sqlserver.sql_statement_starting
(
  ACTION
  (
    package0.event_sequence,
    sqlserver.session_id,
    sqlserver.client_app_name,
    sqlserver.client_hostname,
    sqlserver.database_name,
    sqlserver.sql_text
  )
),
ADD EVENT sqlserver.sql_statement_completed
(
  ACTION
  (
    package0.event_sequence,
    sqlserver.session_id,
    sqlserver.client_app_name,
    sqlserver.client_hostname,
    sqlserver.database_name,
    sqlserver.sql_text
  )
)
ADD TARGET package0.event_file
(
  SET filename = N'D:\XEvents\OrderExample.xel'
)
WITH
(
  MAX_DISPATCH_LATENCY = 30 SECONDS,
  TRACK_CAUSALITY = ON
);
Why this matters: on busy systems, multiple events can share nearly identical timestamps, and asynchronous dispatch can make “completed” appear before “starting” in the captured output. Adding sequencing and/or causality metadata prevents false narratives during troubleshooting.
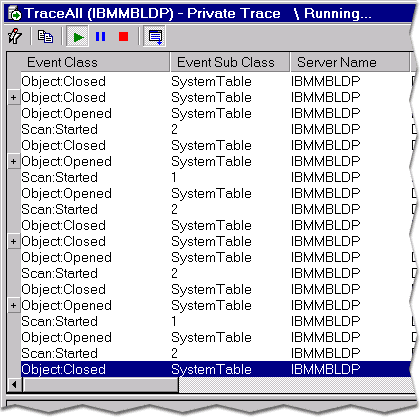
Example Output: What Captured Data Looks Like
Once you capture data to an event_file target, you can review the .xel file in SSMS or query it using T-SQL for repeatable analysis pipelines.
Extended Events - Exercise
Extended Events - Exercise
The next lesson covers the information (columns/actions/fields) that can be captured with events.