| Lesson 5 | Event payload fields |
| Objective | Identify the Events, Actions, Predicates, and Targets. |
Extended Events: Events, Actions, Predicates, Targets
In older SQL Server releases (SQL Trace / Profiler), you typically selected Event Classes and Data Columns, applied filters, then wrote output to a trace file or trace table. In modern SQL Server, Extended Events (XEvents / XE) uses a modular design:
- Events: what you want to observe (for example, batch completion, RPC completion, deadlock graphs).
- Actions: extra context you choose to attach to an event (similar to “data columns” in Profiler).
- Predicates: filters that decide which fired events are actually captured.
- Targets: where the captured event stream is written (file, memory ring buffer, histogram, and others).
Concept mapping from SQL Trace to Extended Events
| SQL Trace / Profiler | Extended Events (XE) | What it means in practice |
|---|---|---|
| Event Class | Event | The occurrence you capture (for example, a statement completes or a deadlock occurs). |
| Data Column | Action (optional) | Extra data you attach to the event (for example, session_id, database_name, client_app_name, sql_text). |
| Filter | Predicate (WHERE clause) | Rules that decide whether the event is collected (for example, duration > 1 second, specific database_id). |
| Trace file / Trace table | Target | Where XE writes results (for example, event_file for production capture; ring_buffer for quick diagnostics). |
Microsoft mapping: Profiler event classes and columns → XE events and actions
A common stumbling block is translating a familiar Profiler template into an Extended Events session. Microsoft documents an official mapping approach: SQL Trace event classes can be mapped to XE events, and SQL Trace columns can be mapped to XE actions. This is useful when you want “equivalent capture” without guessing which XE objects to pick.
Step 1: Find the XE event(s) equivalent to a SQL Trace event class
The mapping data is stored in the master database. The query below lists trace event classes and their XE equivalents (where available).
-- Trace event class ➜ XE event mapping
SELECT
  te.name            AS trace_event_class,
  xem.package_name   AS xe_package,
  xem.xe_event_name  AS xe_event
FROM sys.trace_events AS te
LEFT JOIN sys.trace_xe_event_map AS xem
  ON te.trace_event_id = xem.trace_event_id
WHERE xem.trace_event_id IS NOT NULL
ORDER BY te.name, xem.package_name, xem.xe_event_name;
Not every SQL Trace event class has an XE equivalent. When an event class does not map, the typical next step is to use a modern feature instead (for example, SQL Server Audit for audit-oriented trace classes).
Step 2: Map SQL Trace columns to XE actions (when an “action equivalent” exists)
Some Profiler columns map cleanly to XE actions. Others do not, because the information is already present as an event payload field on the XE event. The query below lists the columns that have explicit action mappings.
-- Trace column ➜ XE action mapping
SELECT
  tc.name            AS trace_column,
  xam.package_name   AS xe_package,
  xam.xe_action_name AS xe_action
FROM sys.trace_columns AS tc
INNER JOIN sys.trace_xe_action_map AS xam
  ON tc.trace_column_id = xam.trace_column_id
ORDER BY tc.name, xam.package_name, xam.xe_action_name;
How to interpret “missing action” mappings
- If a trace column does not map to an action, it may be because the equivalent data is already included as a default payload field on the XE event (no action required).
- Some trace columns are conceptually unnecessary in XE (for example, “EventClass”), because the XE event name already provides that meaning.
Special case: UserConfigurable events
SQL Trace supported multiple “UserConfigurable” event classes. Extended Events consolidates these into a single XE event named user_event,
raised via the same stored procedure used by SQL Trace. In XE, you can filter by the returned event_id to isolate the specific logical event you want.
-- Example pattern: capture user-defined events and filter by a specific event_id
CREATE EVENT SESSION [XE_UserEvents] ON SERVER
ADD EVENT sqlserver.user_event
(
  ACTION(sqlserver.session_id, sqlserver.client_app_name)
  WHERE ([event_id] = 82)  -- Example: match the legacy UserConfigurable event ID used by the code
)
ADD TARGET package0.event_file
(
  SET filename = N'C:\XE\XE_UserEvents.xel',
      max_file_size = (25),
      max_rollover_files = (4)
);
1) Events: the core “what happened” payload
Every Extended Events event has its own built-in payload fields. For example, “completed” events often include duration and resource usage fields, while deadlock events provide a deadlock graph. This is a key difference from Profiler: XE does not provide one universal “column set” for all events. You pick the event(s), then inspect the fields available for those events.
Administrative tip: when you are unsure what a given event exposes, query XE metadata (events and fields) instead of guessing.
-- Discover fields available for a specific event (example: sql_batch_completed)
SELECT
  oc.name        AS field_name,
  oc.type_name   AS field_type,
  oc.description AS field_description
FROM sys.dm_xe_object_columns AS oc
WHERE oc.object_name = N'sql_batch_completed'
  AND oc.column_type = N'data'
ORDER BY oc.name;
2) Actions: “data columns” you explicitly attach
Actions are optional data points you add to an event to provide context (who ran it, which database, which session, the SQL text, and so on). Actions are the closest conceptual match to Profiler “data columns,” but you attach them per event and per session.
Best practice: start with a minimal set of actions, then add only what you need. Common starter actions for query troubleshooting include: session_id, database_name (or database_id), client_app_name, client_hostname, username, and sql_text.
-- List available actions on your server
SELECT
  p.name        AS package_name,
  o.name        AS action_name,
  o.description AS action_description
FROM sys.dm_xe_objects AS o
JOIN sys.dm_xe_packages AS p
  ON p.guid = o.package_guid
WHERE o.object_type = N'action'
ORDER BY p.name, o.name;
3) Predicates: filter early, capture less noise
Predicates are filters in the WHERE clause of an event definition. They decide which fired events are actually collected.
This is a major reason XE is lightweight: when the predicate is false, the event is dropped before action/target processing.
-- Example: capture only slow statements, and only for one database
CREATE EVENT SESSION [XE_SlowStatements] ON SERVER
ADD EVENT sqlserver.sql_statement_completed
(
  ACTION
  (
    sqlserver.session_id,
    sqlserver.database_name,
    sqlserver.client_app_name,
    sqlserver.username,
    sqlserver.sql_text
  )
  WHERE
  (
    [duration] >= (1000000)                 -- 1 second (microseconds)
    AND [sqlserver].[database_name] = N'YourDatabaseName'
  )
)
ADD TARGET package0.event_file
(
  SET filename = N'C:\XE\XE_SlowStatements.xel',
      max_file_size = (50),
      max_rollover_files = (4)
)
WITH
(
  MAX_DISPATCH_LATENCY = 5 SECONDS,
  TRACK_CAUSALITY = ON
);
4) Targets: where your XE data lands
A target is the destination for captured events. Two widely used targets are:
- event_file: recommended for most production captures (durable, supports rollover, easy to share and archive).
- ring_buffer: in-memory, convenient for short interactive investigations, but not durable and can overwrite old entries.
You can view XE output in SSMS, and you can also query .xel files using built-in functions when you want repeatable reporting or automation.
-- Read an event_file target (one row per captured event)
SELECT
  CAST(event_data AS xml) AS event_data_xml
FROM sys.fn_xe_file_target_read_file
(
  N'C:\XE\XE_SlowStatements*.xel',
  NULL, NULL, NULL
);
Common “payload fields” and “actions” you will use frequently
The legacy Profiler list below is still useful as a checklist, but in XE you typically split it into: (a) event payload fields that come with the chosen event, and (b) actions you attach for context.
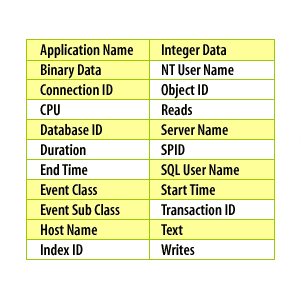
- Application Name → typically captured as an action (for example: client_app_name).
- CPU / Duration / Reads / Writes → typically event payload fields on “completed” events.
- Database → often captured as database_name (action) or database_id depending on the event and your needs.
- SPID / Session → commonly captured as session_id (action).
- User → commonly captured as username (action), sometimes paired with client_hostname.
- Text → commonly captured as sql_text (action) when supported/appropriate for the event.
- Start/End Time → captured via timestamp and event payload fields (varies by event).
Ordering, correlation, and “trace order” in XE
If you need to reconstruct execution flow under concurrency, you typically use:
- TRACK_CAUSALITY to correlate related work using activity identifiers and sequencing.
- package0.event_sequence (an action you add) when you want a per-session event counter that supports deterministic sorting during analysis.
SQL Server 2025: time-bound sessions (MAX_DURATION guardrail)
SQL Server 2025 adds a DBA-friendly safety net: you can define a maximum run time for an XE session. After the specified duration elapses, SQL Server automatically stops the session. This reduces the risk of a “forgotten session” consuming resources and generating excessive output.
-- Time-bound XE session pattern (stop automatically after MAX_DURATION)
CREATE EVENT SESSION [XE_BurstCapture] ON SERVER
ADD EVENT sqlserver.sql_batch_completed
(
  ACTION(sqlserver.session_id, sqlserver.database_name, sqlserver.sql_text)
)
ADD TARGET package0.event_file
(
  SET filename = N'C:\XE\XE_BurstCapture.xel',
      max_file_size = (50),
      max_rollover_files = (2)
)
WITH
(
  MAX_DURATION = 2 HOURS,
  MAX_DISPATCH_LATENCY = 5 SECONDS
);
GO

ALTER EVENT SESSION [XE_BurstCapture] ON SERVER STATE = START;
Operational note: if you stop the session early and start it again later, the MAX_DURATION timer resets when the session is started.
The maximum supported duration is approximately 24 days (2,147,483 seconds).
-- Confirm MAX_DURATION on existing sessions (value stored as seconds in metadata)
SELECT
  name,
  max_duration,
  startup_state
FROM sys.server_event_sessions
WHERE name = N'XE_BurstCapture';
In the next lesson, you will learn how to interpret XE output fields (and how they differ from legacy Profiler “columns”) for troubleshooting.