| Lesson 6 | Extended Events and Sessions |
| Objective | Run extended events and sessions |
Run Extended Events Sessions in SQL Server
In modern SQL Server, performance and diagnostic monitoring is built around Extended Events (XE / XEvents).
You do not “run traces” anymore—your operational workflow is to create an Extended Events session, start it, view data live or
write results to a target (usually an .xel file), then stop and analyze the capture.
What you need before you start
- SSMS: Use a current SQL Server Management Studio build for the best XE session UI (Wizard + Live Data viewer).
- Permissions: Your login must be able to create/alter sessions and view runtime data. In many environments, this is handled via server permissions such as CREATE ANY EVENT SESSION / ALTER ANY EVENT SESSION plus VIEW SERVER PERFORMANCE STATE for viewing.
- Storage path planning: If you use an
event_filetarget, choose a path with sufficient space and a rollover policy.
Extended Events session lifecycle
Think of an XE session as a repeatable diagnostic instrument you define once and run when needed:
- Define the session (events + actions + predicates + targets + session options).
- Start the session (capture begins immediately).
- Observe live data (optional) while the session runs.
- Stop the session (capture ends; definition remains).
- Analyze the target output (
.xelfile in SSMS or via T-SQL). - Drop the session if it was temporary.
Method A: Create and run a session in SSMS
1) Create the session (SSMS wizard)
- Open Object Explorer.
- Expand Management → Extended Events → Sessions.
- Right-click Sessions → New Session Wizard… (or New Session…).
- Name the session using a descriptive purpose (example:
XE_SlowStatementsorXE_Deadlocks).
2) Choose the events you want to capture
Select events that match your troubleshooting goal. Common starting points:
- Slow query capture: statement/batch completed events (with duration/CPU/reads payload fields).
- Blocking/deadlocks: deadlock-related events and lock-related events (as needed).
- Errors: error reporting events when troubleshooting failures.
3) Add actions for context
Actions are the “who/where/what context” you attach to the event stream: session id, database name, application name, user name, SQL text, and so on. Start minimal—only add what you will actually use to filter and analyze.
4) Apply predicates (filters)
Filters reduce overhead and noise. For example, only capture duration ≥ 1 second, or only capture activity in one database. Aggressive filtering is a best practice for production troubleshooting.
5) Choose a target
- event_file: best default for real troubleshooting (durable, shareable, supports rollover).
- ring_buffer: quick, in-memory look at recent activity (not durable; older entries can be overwritten).
6) Start the session and view Live Data
- Right-click the session → Start Session.
- Right-click again → Watch Live Data to see events as they arrive.
- When finished, right-click → Stop Session.
Method B: Create, start, stop, and analyze a session with T-SQL
Scripting is ideal when you want repeatability (runbooks, incident response, jobs, and consistent production workflows).
The example below captures slow statements to an event_file target with rollover, causality tracking, and a time limit.
-- Create a session to capture slow statements with useful context
CREATE EVENT SESSION [XE_SlowStatements] ON SERVER
ADD EVENT sqlserver.sql_statement_completed
(
  ACTION
  (
    sqlserver.session_id,
    sqlserver.database_name,
    sqlserver.client_app_name,
    sqlserver.username,
    sqlserver.sql_text,
    package0.event_sequence
  )
  WHERE
  (
    [duration] >= (1000000) -- 1 second (microseconds)
  )
)
ADD TARGET package0.event_file
(
  SET filename = N'C:\XE\XE_SlowStatements.xel',
      max_file_size = (50),
      max_rollover_files = (4)
)
WITH
(
  MAX_DISPATCH_LATENCY = 5 SECONDS,
  TRACK_CAUSALITY = ON,
  MAX_DURATION = 2 HOURS
);
GO

-- Start the session
ALTER EVENT SESSION [XE_SlowStatements] ON SERVER STATE = START;
GO

-- Stop the session when finished
ALTER EVENT SESSION [XE_SlowStatements] ON SERVER STATE = STOP;
GO
Analyze the captured output
If you used event_file, you can open the .xel file in SSMS, or query it with T-SQL for automation and reporting.
-- Read events from the XEL file (one row per event)
SELECT
  CAST(event_data AS xml) AS event_data_xml
FROM sys.fn_xe_file_target_read_file
(
  N'C:\XE\XE_SlowStatements*.xel',
  NULL, NULL, NULL
);
Best practice: treat sessions like controlled diagnostics, not permanent tracing
- Prefer event_file + rollover for production investigation (avoid unlimited growth).
- Use MAX_DURATION in SQL Server 2025 when sessions are intended to be temporary (prevents “forgotten session” incidents).
- Filter early (predicates) and minimize actions (context) to keep overhead low.
- Name sessions by purpose and keep scripts in your runbook repository.
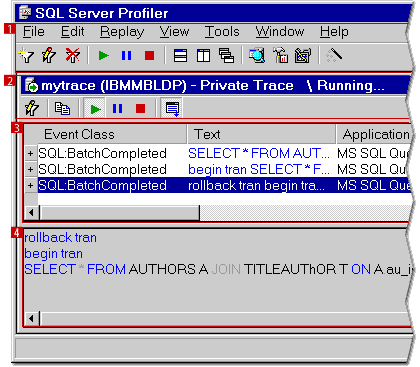
Legacy reference: Profiler images kept for historical context
The images below come from the legacy SQL Server Profiler era. They are preserved on this site to help you recognize older tooling in legacy documentation.
In modern SQL Server, you will start/stop XE sessions (SSMS “Start Session / Stop Session” or ALTER EVENT SESSION) rather than
“run traces.”
package0.event_sequence to reconstruct deterministic ordering during analysis.
.xel output from an event_file target.

ALTER EVENT SESSION [name] ON SERVER STATE = START;
In the next lesson, you will build on this workflow by interpreting session output fields and turning XE captures into repeatable tuning decisions.