| Lesson 7 | Query Store regression analysis |
| Objective | Explain how administrator can execute query store regression analysis in SQL Server |
Query Store Regression Analysis in SQL Server
Legacy SQL Server workflows often used “capture and replay” traces to reproduce a workload and then diagnose performance issues in a lab. In modern SQL Server, the most practical regression workflow is Query Store regression analysis: you compare performance across time windows, identify which queries regressed, and then stabilize performance using Query Store tools such as Force Plan and Query Store hints.
What “regression” means in Query Store
A regression is a measurable performance drop for a query that used to run acceptably and now runs materially worse. In Query Store, regression analysis is typically driven by one (or both) of these patterns:
- Plan change regression: the query gets a different plan, and the new plan is slower (CPU, duration, logical reads, or waits).
- Same plan, worse runtime: the plan is unchanged but runtime metrics degrade due to data growth, skew, parameter sensitivity, or resource pressure.
Administrator runbook: execute regression analysis
Step 1: Confirm Query Store is enabled and collecting data
Query Store must be enabled for the database, and it must be able to persist runtime stats. Operationally, the most common failure mode is a database where Query Store is enabled but not writing (for example, it becomes read-only due to storage limits). Use SSMS to confirm status and storage.
-- Enable Query Store (run in the target database context)
ALTER DATABASE CURRENT SET QUERY_STORE = ON;
GO
Administrative guidance: size Query Store deliberately and monitor it. Regression analysis depends on retaining enough history to compare “before” and “after”.
Step 2: Use SSMS “Regressed Queries” report for the fastest triage
In SSMS, open your database and navigate to the Query Store reports. The Regressed Queries report is designed for regression triage: it compares query performance across two time intervals and highlights candidates where performance dropped, often due to a plan change.
- Select the baseline window (for example, “last 7 days” before a deployment) and the recent window (for example, “last 24 hours”).
- Sort by a meaningful metric (duration, CPU, logical reads) and focus on the largest deltas.
- Use the plan summary to compare plans and observe which plan correlates with the regression.
Step 3: Stabilize performance with “Force Plan” when appropriate
If a query regressed because a new plan is worse, the quickest mitigation is often forcing the last known good plan. You can do this from SSMS
(Force Plan button in the report), or via T-SQL using sp_query_store_force_plan.
-- Force a specific plan for a specific query_id (Query Store IDs)
EXEC sp_query_store_force_plan @query_id = 123, @plan_id = 456;
GO
Operational note: plan forcing is a mitigation, not a root-cause fix. After stabilizing, investigate why plan selection changed (statistics updates, parameter sensitivity, schema/index changes, compatibility level changes, etc.).
Step 4: If plan forcing is not the right fix, apply Query Store hints
For SQL Server 2022+ environments, Query Store can apply hints to a query (by query_id) without changing application code. This is useful when:
- A plan is stable but needs a consistent hint (for example,
MAXDOP,RECOMPILE, or otherOPTION(...)hints). - You need a fast, reversible change during an incident, and a code release is not feasible.
-- Apply a Query Store hint without changing application code (SQL Server 2022+)
EXEC sys.sp_query_store_set_hints
  @query_id = 123,
  @query_hints = N'OPTION (RECOMPILE)';
GO
Step 5: Use Automatic Plan Correction where it fits your governance model
Automatic plan correction (Automatic Tuning) uses Query Store history to detect plan-choice regression and automatically force a last known good plan. This can reduce mean time to recovery for common regressions, but it should be enabled only with operational ownership and monitoring.
Repeatable “top regressed queries” query (T-SQL)
SSMS reports are ideal for interactive work. For automation (weekly review, incident tooling, dashboards), query Query Store runtime stats and compare a recent interval versus a baseline interval.
/* Example pattern:
   - Compare avg duration for a recent window vs a baseline window.
   - Adjust time windows to match your operational workflow.
*/
DECLARE @recent_start   datetime2 = DATEADD(HOUR, -24, SYSUTCDATETIME());
DECLARE @baseline_start datetime2 = DATEADD(DAY,  -7,  SYSUTCDATETIME());
DECLARE @baseline_end   datetime2 = DATEADD(DAY,  -6,  SYSUTCDATETIME());

WITH interval_stats AS
(
  SELECT
    qsq.query_id,
    qsp.plan_id,
    rsi.start_time,
    rsi.end_time,
    rs.avg_duration,
    rs.avg_cpu_time,
    rs.avg_logical_io_reads,
    rs.count_executions
  FROM sys.query_store_query AS qsq
  JOIN sys.query_store_plan  AS qsp ON qsp.query_id = qsq.query_id
  JOIN sys.query_store_runtime_stats AS rs
    ON rs.plan_id = qsp.plan_id
  JOIN sys.query_store_runtime_stats_interval AS rsi
    ON rsi.runtime_stats_interval_id = rs.runtime_stats_interval_id
)
, recent AS
(
  SELECT
    query_id,
    AVG(avg_duration) AS recent_avg_duration,
    AVG(avg_cpu_time) AS recent_avg_cpu,
    AVG(avg_logical_io_reads) AS recent_avg_reads,
    SUM(count_executions) AS recent_execs
  FROM interval_stats
  WHERE start_time >= @recent_start
  GROUP BY query_id
)
, baseline AS
(
  SELECT
    query_id,
    AVG(avg_duration) AS base_avg_duration,
    AVG(avg_cpu_time) AS base_avg_cpu,
    AVG(avg_logical_io_reads) AS base_avg_reads,
    SUM(count_executions) AS base_execs
  FROM interval_stats
  WHERE start_time >= @baseline_start
    AND end_time   <  @baseline_end
  GROUP BY query_id
)
SELECT TOP (20)
  r.query_id,
  r.recent_execs,
  b.base_execs,
  r.recent_avg_duration,
  b.base_avg_duration,
  CASE
    WHEN b.base_avg_duration > 0
      THEN (r.recent_avg_duration - b.base_avg_duration) / b.base_avg_duration
    ELSE NULL
  END AS duration_regression_ratio
FROM recent r
JOIN baseline b
  ON b.query_id = r.query_id
WHERE r.recent_execs >= 10
  AND b.base_execs   >= 10
ORDER BY duration_regression_ratio DESC;
How this replaces “trace replay” thinking
Trace replay attempted to reproduce a workload so you could observe what happened. Query Store regression analysis starts from the opposite direction: it uses real workload history already captured in the database, then points you directly at “what got worse”, “when it got worse”, and “which plan correlates with the slowdown”.
Legacy images kept for historical context
The images below come from the trace replay era. They are preserved to help you recognize older tooling in legacy documentation. In modern practice, Query Store reports (especially Regressed Queries) plus plan forcing/hints are the primary administrator workflow.
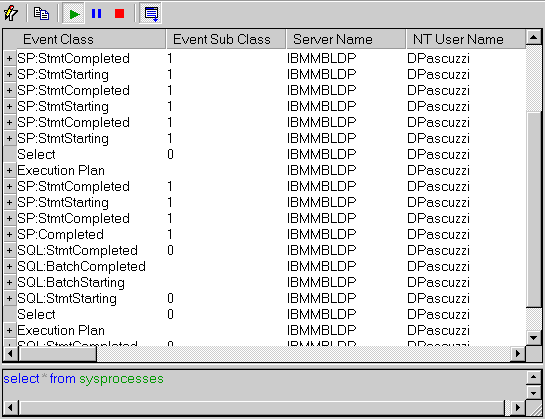
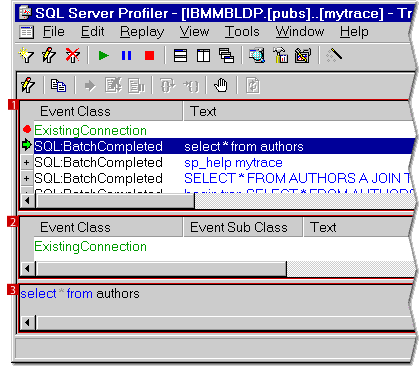
- Legacy traced events. Query Store replaces “replayed events” with plan and runtime history per query_id.
- Modern mitigation. If the regression is plan-choice related, Force Plan (or unforce later) is the fastest stabilizer.
- Modern alternatives. If forcing is inappropriate, use Query Store hints or pursue root-cause tuning (indexes, stats, parameter sensitivity fixes).
SQL Server Profiler - Quiz
Sql Server Profiler - Quiz