| Lesson 2 | Extended Events/XEvents |
| Objective | Identify the key features of Extended Events/XEvents in SQL Server. |
Key Features of Extended Events (XEvents) in SQL Server
Extended Events (often abbreviated XE or XEvents) is SQL Server’s primary, long-term instrumentation framework for performance monitoring and troubleshooting. It replaces the legacy SQL Trace/Profiler workflow for Database Engine tracing by providing a more configurable, lower-overhead way to capture exactly the diagnostics you need—then store, stream, and analyze the results using SSMS and T-SQL.
Extended Events is built around a few core ideas: a session collects events; events can include extra context via actions; captured data is written to one or more targets; and predicates (filters) restrict what is captured so you avoid noisy, high-volume traces.
The images below were originally used to describe the Profiler mindset (trace + events + filters), but the same visual structure maps well to Extended Events once you translate the terminology to session, events, targets, and predicates.
Extended Events Components
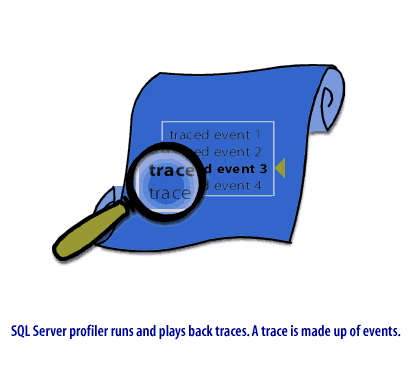
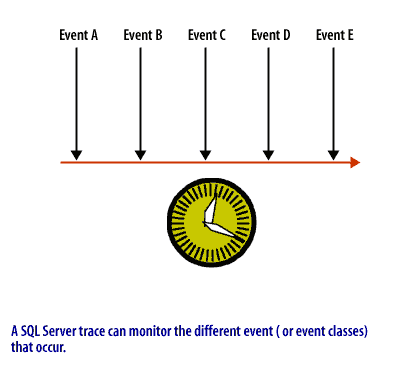
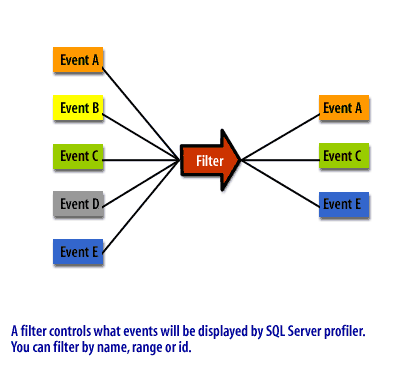
If you used older SQL Server toolchains: SQL Server Profiler was the classic GUI for SQL Trace. That approach is now considered legacy for Database Engine monitoring. Extended Events is the modern replacement and the platform where Microsoft continues to invest.
Key Features You Should Recognize
- Event sessions (server-scoped and database-scoped): A session is the container that defines what you capture. Sessions can be started/stopped on demand and left in place as reusable “diagnostic profiles.”
- Events, actions, and payload design: Events represent something that happened (e.g., a statement completed, a deadlock occurred). Actions add context (e.g., sql_text, client_app_name). The combination determines how actionable your captured data is.
-
Targets:
Where captured data goes. Common targets include:
- event_file (writes .xel files; best for most investigations and post-analysis)
- ring_buffer (in-memory; convenient but easier to overwrite/lose data during busy periods)
- histogram / pair_matching (specialized targets for quick aggregations or correlation patterns)
- Predicates (filters) and “capture only what matters”: The fastest XE session is the one that never captures irrelevant events. Predicates reduce overhead and shrink analysis time.
-
SSMS workflow support:
SSMS provides a GUI to:
- Create sessions using “New Session…” or templates (including the simplified “XEvent Profiler” experience in many environments).
- Start/stop sessions and validate configuration.
- Watch Live Data for streaming diagnostics during an active incident.
- Open and filter .xel files for offline analysis and export.
- Queryable output (T-SQL + XML): When you capture to event_file, you can query results using built-in functions and reshape the payload using XQuery, which is ideal for repeatable investigations and report automation.
- Designed for correlation: Extended Events supports correlation patterns that are difficult or expensive in legacy tracing (for example, grouping related activity and correlating events).
Minimal, Practical XE Pattern (SSMS + Event File)
For most production-style investigations, start with this baseline: create a session, add only a small set of high-value events, add actions for context, filter aggressively, and write to an event_file target. Then review results either in SSMS or with T-SQL.
-- Example analysis pattern: read XEL output from an event_file target
-- (Your path and filename pattern will match your session configuration.)

SELECT
  CAST(event_data AS XML) AS event_data
FROM sys.fn_xe_file_target_read_file(
  'D:\XEvents\MySession*.xel',  -- file pattern
  NULL,                        -- mdpath (optional)
  NULL,                        -- initial file name (optional)
  NULL                         -- initial offset (optional)
);
In the next lesson, you will build and run a session (a modern “trace equivalent”) and learn how to interpret captured events for typical monitoring tasks such as slow query investigation, blocking analysis, and error diagnostics.