| Lesson3 | Traces |
| Objective | Create a trace file in SQL Server |
Create Trace Filters with Extended Events XEvents
SQL Server still supports the concept of “tracing,” but the underlying technology has changed. Legacy SQL Trace and SQL Server Profiler traces produced .trc output and are now deprecated.
In SQL Server 2022, the modern replacement is Extended Events (XEvents), which captures events in a lightweight, production-safe way and can write results to an event_file target that produces .xel files.
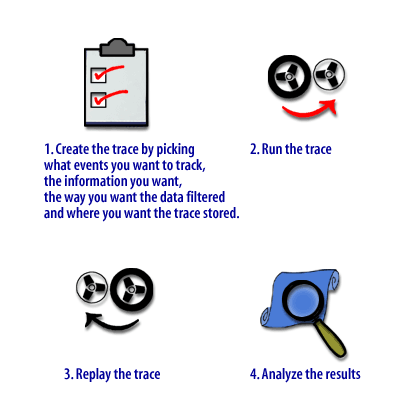
- Define what to capture: events, data fields, and filters.
- Start the capture session.
- Stop the session after the issue occurs.
- Review and analyze the captured results.
In SQL Server 2022, these steps are implemented with an Extended Events session, not a legacy Profiler trace.
What “Filters” Mean in Extended Events
A trace without filters becomes noisy and difficult to interpret. The objective is to capture only the events that matter, for the shortest window of time possible, and with predicates that eliminate irrelevant traffic. In Extended Events, filters are defined as predicates (for example, “duration greater than X” or “database name equals Y”) so the engine can discard irrelevant events early.
Choose a Target: event_file vs ring_buffer
Extended Events sessions capture data and then send it to one or more “targets”:
-
event_filetarget — writes to disk as.xel. Use this for longer captures, higher volume, intermittent issues (deadlocks, timeouts), or when you need historical evidence. -
ring_buffertarget — keeps a rolling window in memory. Use this for quick, ad-hoc troubleshooting, but understand it is volatile and size-limited.
Create an Extended Events Session that Writes an XEL File
The practical “create trace + filters” workflow in SQL Server 2022 is:
- Name the session so its purpose is obvious (example:
CoinPerfCapture). - Select the events that match your problem (batch completed, RPC completed, deadlock, errors, waits, etc.).
- Add useful fields (duration, CPU, reads, rowcount, database name, client app, username).
- Add predicates (filters) to narrow the capture window and reduce noise.
- Write to
event_fileto generate an.xeltrace file you can analyze later.
Below is a compact starter script that behaves like a “Profiler-equivalent” capture for slow queries.
It captures completed batches and RPC calls, filters to one database, and writes to an .xel file.
-- Example: Extended Events session that writes an .xel file
-- Update the file path to a valid folder on your SQL Server host.

CREATE EVENT SESSION [CoinPerfCapture]
ON SERVER
ADD EVENT sqlserver.rpc_completed
(
  ACTION
  (
    sqlserver.client_app_name,
    sqlserver.client_hostname,
    sqlserver.database_name,
    sqlserver.session_id,
    sqlserver.sql_text,
    sqlserver.username
  )
  WHERE
  (
    sqlserver.database_name = N'COIN'
    AND duration >= 1000000   -- microseconds (1 second)
  )
),
ADD EVENT sqlserver.sql_batch_completed
(
  ACTION
  (
    sqlserver.client_app_name,
    sqlserver.client_hostname,
    sqlserver.database_name,
    sqlserver.session_id,
    sqlserver.sql_text,
    sqlserver.username
  )
  WHERE
  (
    sqlserver.database_name = N'COIN'
    AND duration >= 1000000
  )
)
ADD TARGET package0.event_file
(
  SET filename = N'C:\XEvents\CoinPerfCapture.xel',
      max_file_size = (50),
      max_rollover_files = (4)
);
GO

ALTER EVENT SESSION [CoinPerfCapture] ON SERVER STATE = START;
GO

-- Reproduce the problem, then stop the capture:
ALTER EVENT SESSION [CoinPerfCapture] ON SERVER STATE = STOP;
GO
How to Review the XEL Output
You have two common analysis options:
-
SSMS UI: open the
.xelfile from SSMS and use the built-in viewer to filter/sort events. -
T-SQL: read the file using
sys.fn_xe_file_target_read_fileso you can query the results.
-- Read XEL events with T-SQL
SELECT
  CAST(event_data AS xml) AS event_data_xml
FROM sys.fn_xe_file_target_read_file
(
  N'C:\XEvents\CoinPerfCapture*.xel',
  NULL,
  NULL,
  NULL
);
Legacy Profiler Screens
The images below show the older Profiler-style “Trace Properties” screens. Treat them as historical reference for the idea of: naming a capture, choosing events, and defining filters. In SQL Server 2022, implement those same decisions using an Extended Events session.
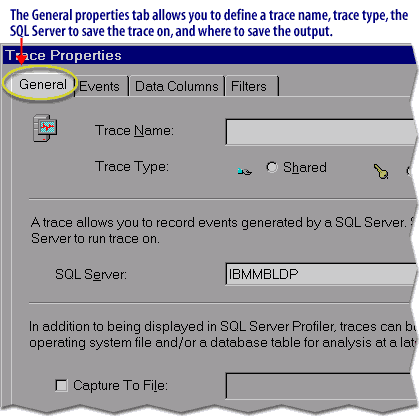
event_file.
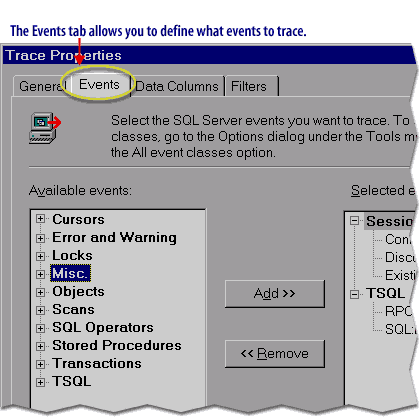
rpc_completed and sql_batch_completed).
Trace Tips for Production-Safe Captures
- Filter aggressively (database, duration, session, app name) to avoid excessive output and overhead.
- Capture only what you need (events + fields). Avoid “capture everything” templates.
- Use event_file for long-running or intermittent issues; use ring_buffer for short, interactive triage.
- Stop the session as soon as you have enough evidence to diagnose the issue.
In the next lesson, you will focus on selecting the correct event types for specific troubleshooting goals (performance, blocking, deadlocks, errors, and auditing).