| Lesson 11 | Working with Crosstab Queries in MS Access |
| Objective | Explain what Crosstab Queries are and how to create them. |
Working with Crosstab Queries
Microsoft Access 365 provides several query types for retrieving, summarizing, creating, and changing data. A Select Query displays records. A Totals Query groups records and calculates aggregate values. An Action Query performs a data operation such as creating a table, appending records, updating records, or deleting records. A Crosstab Query is different because it summarizes data in a matrix-like layout with row headings, column headings, and calculated values at the intersections.
A Crosstab Query is useful when a normal row-by-row result set does not give the best view of summarized information. Instead of listing every detail record, the query rotates one field across the top as column headings and groups another field down the left side as row headings. The result is a compact summary that is easier to read, especially when comparing values across time periods, categories, regions, departments, or other repeated classifications.
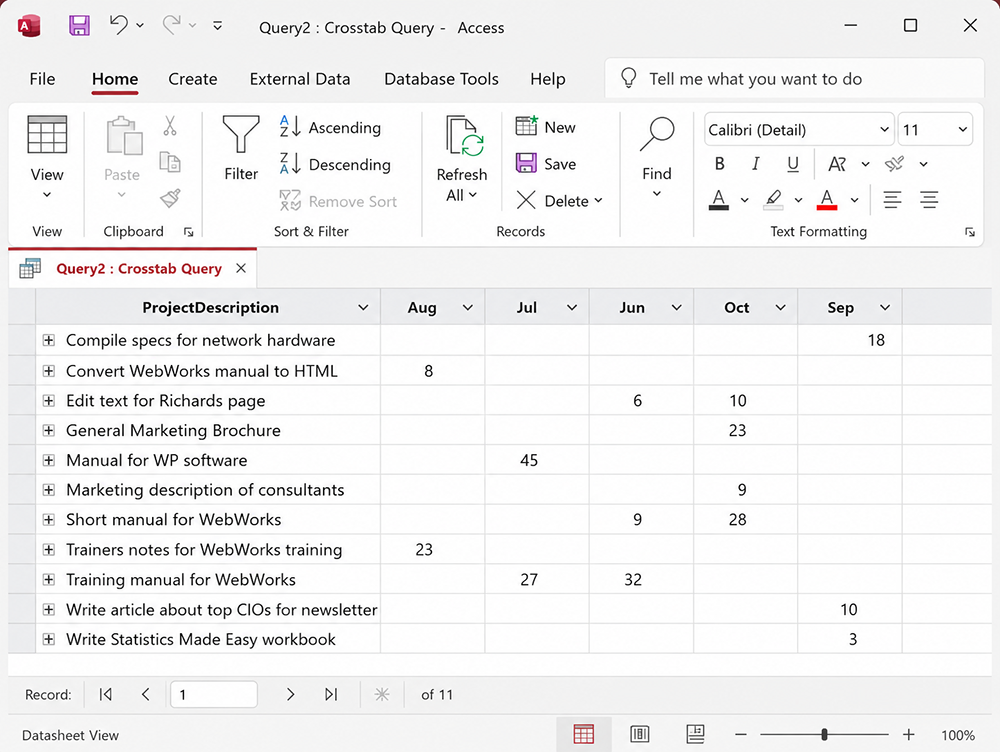
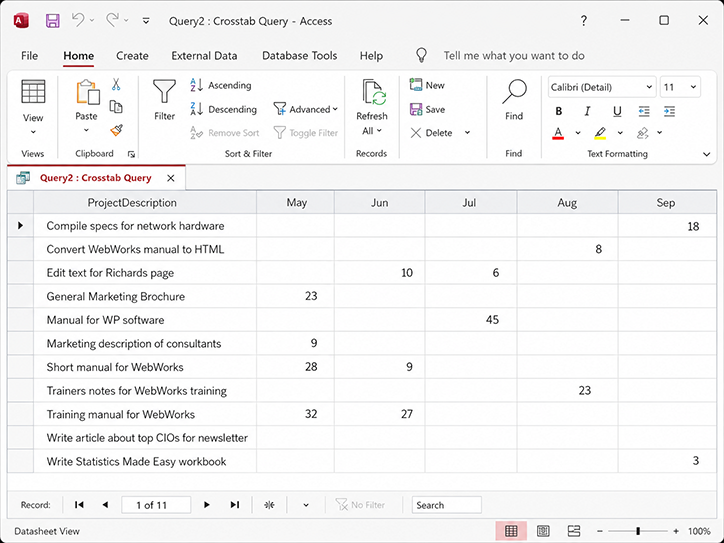
In this lesson, the Crosstab Query summarizes hours worked by project and by month. The project description appears down the left side of the result. The months appear across the top. The hours worked are summed at the intersection of each project and month. This allows the user to answer a question such as: how many hours were worked for each project during each month?
What a Crosstab Query Shows
A Crosstab Query produces a cross-tabulation of data. The term cross-tabulation means that data is summarized across two dimensions. One dimension becomes the row heading. Another dimension becomes the column heading. A third value is calculated where the row and column meet.
For example, a project-hours database may store one row for each work entry. Each work entry may contain a project, a date worked, and the number of hours worked. A regular Select Query can list those rows. A Totals Query can group the rows by project. A Crosstab Query can go further by showing each project as a row and each month as a column.
This format is useful because it presents a summary that resembles a report or spreadsheet-style matrix. Users can compare months across the same project and compare projects within the same month. Blank cells indicate that no summarized value exists for that project-month combination.
The Three Parts of a Crosstab Query
A Crosstab Query depends on three required parts: a row heading, a column heading, and a value. These parts determine how the output is arranged and what calculation appears in the result.
Row Heading
The Row Heading appears down the left side of the Crosstab Query result. In this lesson, the row heading is ProjectDescription. Each project description appears as a separate row. If multiple records exist for the same project, Access groups those records under the same row heading.
Column Heading
The Column Heading appears across the top of the Crosstab Query result. In this lesson, the column heading is a calculated month value derived from the DateWorked field. Each distinct month value becomes a column in the result.
Value
The Value is the summarized measurement shown at the intersection of the row heading and column heading. In this lesson, the value is HoursWorked. Because more than one work entry may exist for the same project in the same month, Access uses an aggregate function such as Sum to calculate the total hours.
Example Crosstab Query
The example query uses project and hours data. The goal is to summarize the number of hours worked for each project during each month. The conceptual design is:
- Row Heading: ProjectDescription
- Column Heading: Month derived from DateWorked
- Value: Sum of HoursWorked
The calculated month field can be created with an expression such as the following:
Month: Format([DateWorked], "mmm")This expression formats the DateWorked value as a three-letter month abbreviation such as May, Jun, Jul, Aug, or Sep. The calculated field can then be used as the column heading in the Crosstab Query.
The important point is that the Month field in this example is not stored as a separate column in the table. It is derived from the date value. This is a common database design pattern. The database stores the actual date, and the query derives the month when a month-based summary is needed.
Creating a Crosstab Query in Access 365
In Microsoft Access 365, a Crosstab Query can be created from Query Design. A practical approach is to begin with a Select Query so that the fields and joins can be checked before the query is changed into a Crosstab Query.
A typical workflow is:
- Open Query Design.
- Add the table or query containing the detail records.
- Add the field that will become the row heading.
- Add the field or calculated expression that will become the column heading.
- Add the numeric or countable field that will become the summarized value.
- Use the Query Design ribbon to convert the query to a Crosstab Query.
- Set the Total row to define grouping and aggregation.
- Set the Crosstab row to define Row Heading, Column Heading, and Value.
- Run or preview the query in Datasheet View.
When the query is converted to a Crosstab Query, Access displays a Total row and a Crosstab row in the query design grid. These rows control how the query groups data and how the final matrix is arranged.
The Total Row and Crosstab Row
The Total row defines how Access groups or summarizes each field. For fields used as row headings or column headings, the Total row is normally set to Group By. For the value field, the Total row uses an aggregate function such as Sum, Count, Avg, Min, or Max.
In this lesson, ProjectDescription is grouped because each project should appear once as a row heading. The calculated Month field is grouped because each month should appear as a column heading. HoursWorked is summed because the result should show total hours for each project-month intersection.
The Crosstab row defines the role of each field in the matrix. The choices are Row Heading, Column Heading, and Value. ProjectDescription is set to Row Heading. Month is set to Column Heading. HoursWorked is set to Value.
Crosstab Queries Compared with Totals Queries
Crosstab Queries are closely related to Totals Queries because both use aggregate functions. A Totals Query might group records by ProjectDescription and return one total number of hours per project. That result is useful, but it does not show how the hours are distributed by month.
A Crosstab Query adds the column-heading dimension. Instead of producing only one summarized row per project, it produces a matrix. The same project can have separate values under May, Jun, Jul, Aug, and Sep. This makes Crosstab Queries especially useful for comparing summarized values across repeated categories.
In database reporting terms, the Crosstab Query provides a more report-ready result than a simple grouped query when the business question requires both a row category and a column category.
Why Month Columns May Appear Out of Order
One issue with month-based Crosstab Queries is column order. If the month is created with a text expression such as:
Month: Format([DateWorked], "mmm")Access treats the resulting month values as text labels. Text values do not automatically sort in calendar order. Depending on the data and the query design, the columns may appear in an order that does not match the normal sequence of months.
For example, a result might display Aug, Jul, Jun, Oct, and Sep rather than May, Jun, Jul, Aug, and Sep. The values are not wrong, but the display order can be confusing. Reports and instructional examples usually require stable, predictable column order.
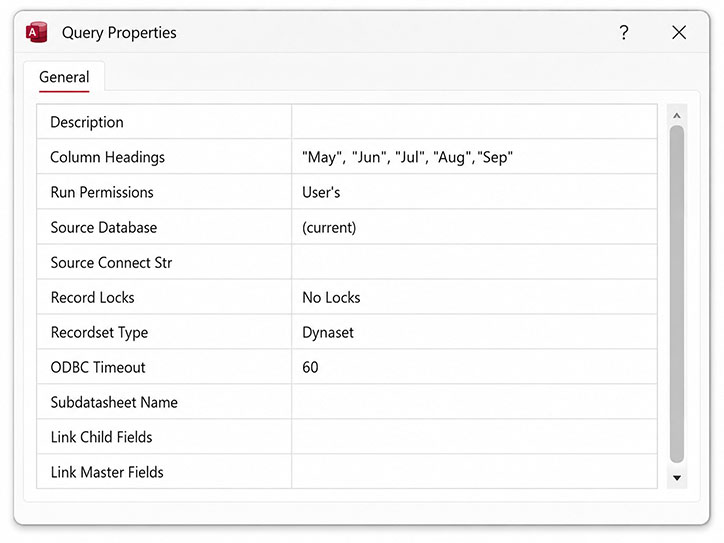
Access provides a query property that solves this problem. The Column Headings property can be used to list the expected column labels in the exact order that should appear in the result.
Controlling Column Headings in Access
In Access 365, the Column Headings property is available through the query's Property Sheet. This property lets you specify the column headings that should appear in the Crosstab Query result. The headings are entered as a comma- separated list.
For the month example in this lesson, the Column Headings property can be set to:
"May","Jun","Jul","Aug","Sep"This tells Access to display the month columns in that specific order. It also makes the output more stable when the query is used in a report or when the same result layout must be reused over time.
Column Heading Values Must Match
The values entered in the Column Headings property must match the values produced by the field or expression assigned to Column Heading in the Crosstab row. This detail is important because Access compares the generated heading values with the fixed list entered in the query property.
In this lesson, the expression:
Month: Format([DateWorked], "mmm")produces month labels such as:
May
Jun
Jul
Aug
Sep
Therefore, the Column Headings property should use matching labels:
"May","Jun","Jul","Aug","Sep"If the expression produces different values, such as full month names instead of abbreviations, the Column Headings property must be adjusted to match those values. For example, if the expression returns January instead of Jan, the property must use "January" instead of "Jan".
Blank Cells and Missing Values
Crosstab Query results often contain blank cells. A blank cell usually means that no records exist for that row-heading and column-heading combination. For example, if a project has no hours recorded in July, the July cell for that project may be blank.
Blank cells should not automatically be interpreted as errors. They often mean that no summarized value exists for that combination. However, for reports, blank cells may need additional handling. Some reports prefer blank cells because they show the absence of data. Other reports may use expressions to display zero instead of a blank value.
Fixed column headings also help when a month has no data at all. Without fixed column headings, Access may omit a column that has no matching records. With fixed column headings, the expected column can still appear, preserving the structure of the result.
Practical Uses for Crosstab Queries
Crosstab Queries are useful whenever a database user needs to summarize records across two categories. In a project database, they can show hours by project and month. In a sales database, they can show sales totals by region and quarter. In an inventory database, they can show quantities by product category and warehouse. In a school database, they can show enrollment counts by course and semester.
Crosstab Queries are also useful for preparing data for reports. A report often needs stable columns, readable row labels, and summarized values. When the Column Headings property is used, the query result becomes more predictable because the columns appear in the intended order even when some values are missing.
The key is to choose the correct row and column dimensions. The row heading should identify the main object being summarized, such as project, customer, product, department, or course. The column heading should identify the category used for comparison, such as month, quarter, status, region, or type. The value should be a field that can be aggregated, such as hours, amount, count, quantity, or cost.
Design Guidelines for Crosstab Queries
A Crosstab Query is easier to maintain when the underlying data model is clean. The detail table should store atomic values, such as one date per work entry and one numeric hours value per record. The query can then group those detail records into the desired summary.
The following guidelines help produce reliable Crosstab Queries:
- Start with a Select Query. Confirm that the base records are correct before converting the query to a Crosstab Query.
- Use meaningful row headings. The row heading should clearly identify each summarized item.
- Use stable column values. Column headings work best when the possible values are predictable, such as months, quarters, or fixed categories.
- Choose the correct aggregate function. Use Sum for totals, Count for record counts, Avg for averages, and Min or Max when the smallest or largest value is needed.
- Control column order when necessary. Use the Column Headings property when the columns must appear in a specific order.
- Check blank cells. Determine whether blanks should remain blank or be converted to zero for reporting purposes.
Lesson Summary
A Crosstab Query summarizes data by placing one grouped field down the left side as row headings, another grouped field across the top as column headings, and an aggregate value at each intersection. In this lesson, ProjectDescription is used as the row heading, a calculated Month expression based on DateWorked is used as the column heading, and HoursWorked is summed as the value.
Crosstab Queries are useful because they turn detail records into a compact, readable summary. They are especially effective for showing values across time periods or categories. In Access 365, Crosstab Queries are created from Query Design by using the Total row and Crosstab row to define how the fields should be grouped, displayed, and summarized.
The Column Headings property is important when the output needs a fixed column order. By entering values such as "May","Jun","Jul","Aug","Sep", the query designer can control the order of month columns and preserve report layout even when some columns have no values. In the next lesson, you will conclude this module and review how the query concepts fit together.